Activity Reports
The Reports section in Netzilo provides administrators with detailed insights into user, authentication, and AI activities. These reports help you monitor security, ensure compliance, and maintain operational oversight of your network.
Available Reports
Netzilo offers three comprehensive report types:
Provides in-depth insights into user interactions within Netzilo:
- User distribution and activity patterns
- Event distribution across different categories
- Detailed analysis of user behaviors
- Security event tracking
Tracks user login activities and authentication patterns:
- Login success rates and trends
- Failed authentication analysis
- Session duration metrics
- Geographic and device analysis
Monitors AI tool usage and MCP interactions:
- AI tool usage patterns and token consumption
- Security scanning results for AI operations
- Risk assessment and compliance tracking
- Performance metrics for AI services
Report Management
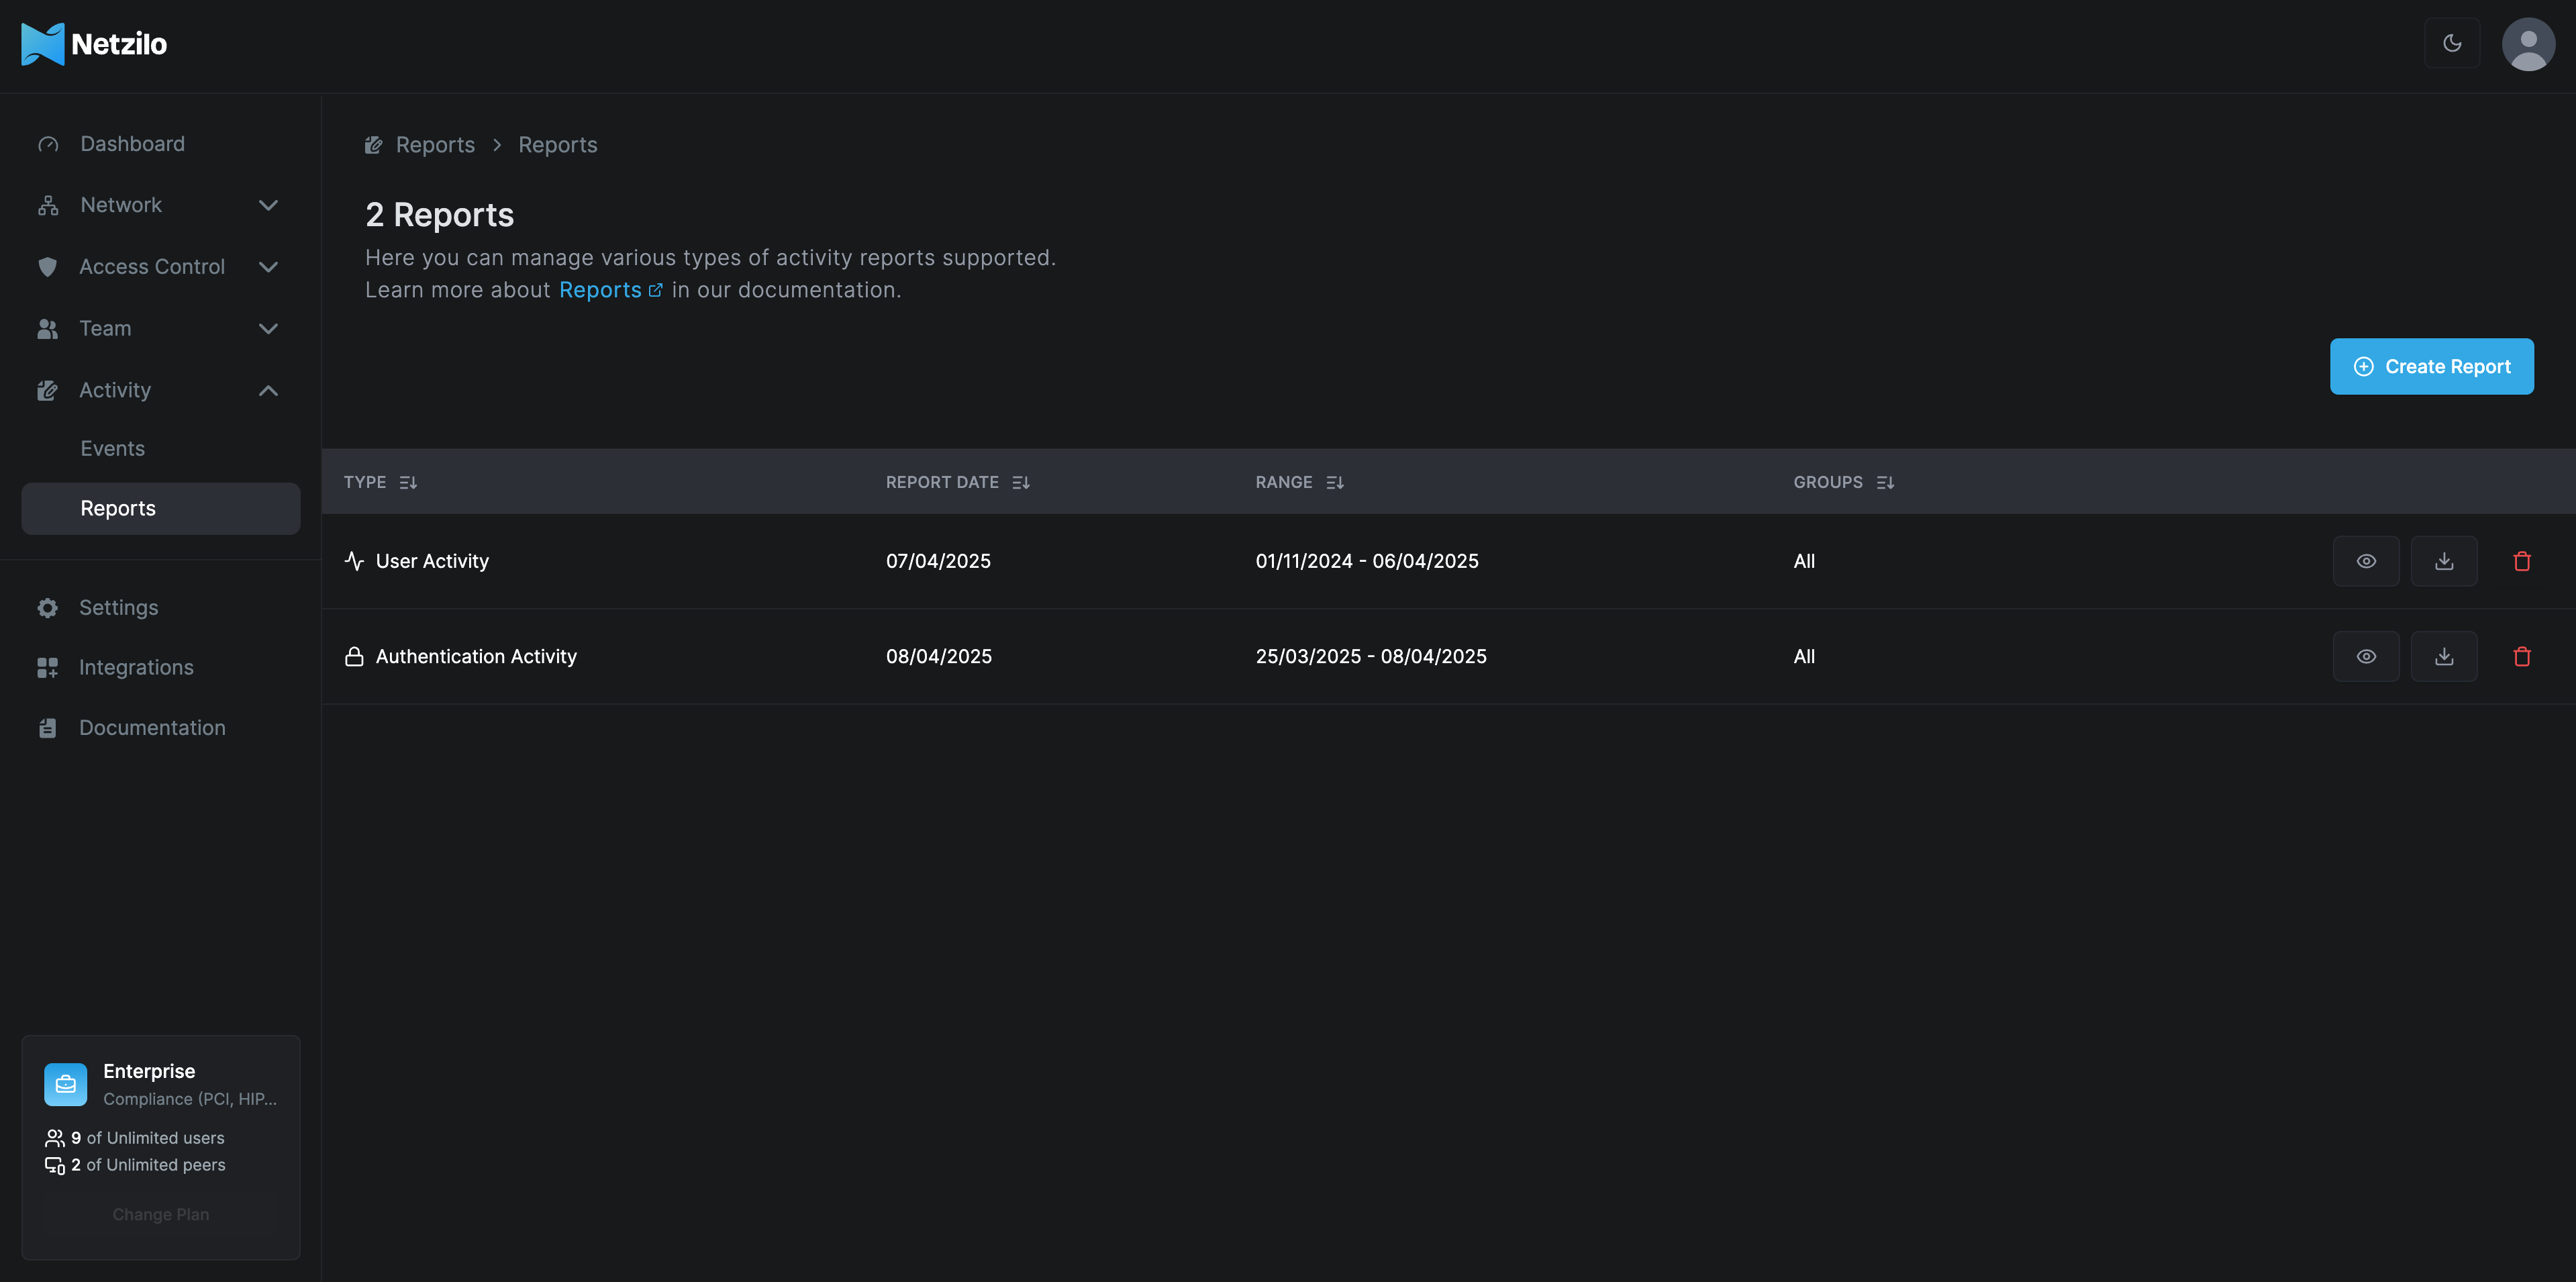
Each report in the system displays:
- Type: The type of activity (User Activity or Authentication Activity)
- Report Date: When the report was created
- Range: The date range covered by the report
- Groups: The user groups included in the report
Creating Reports
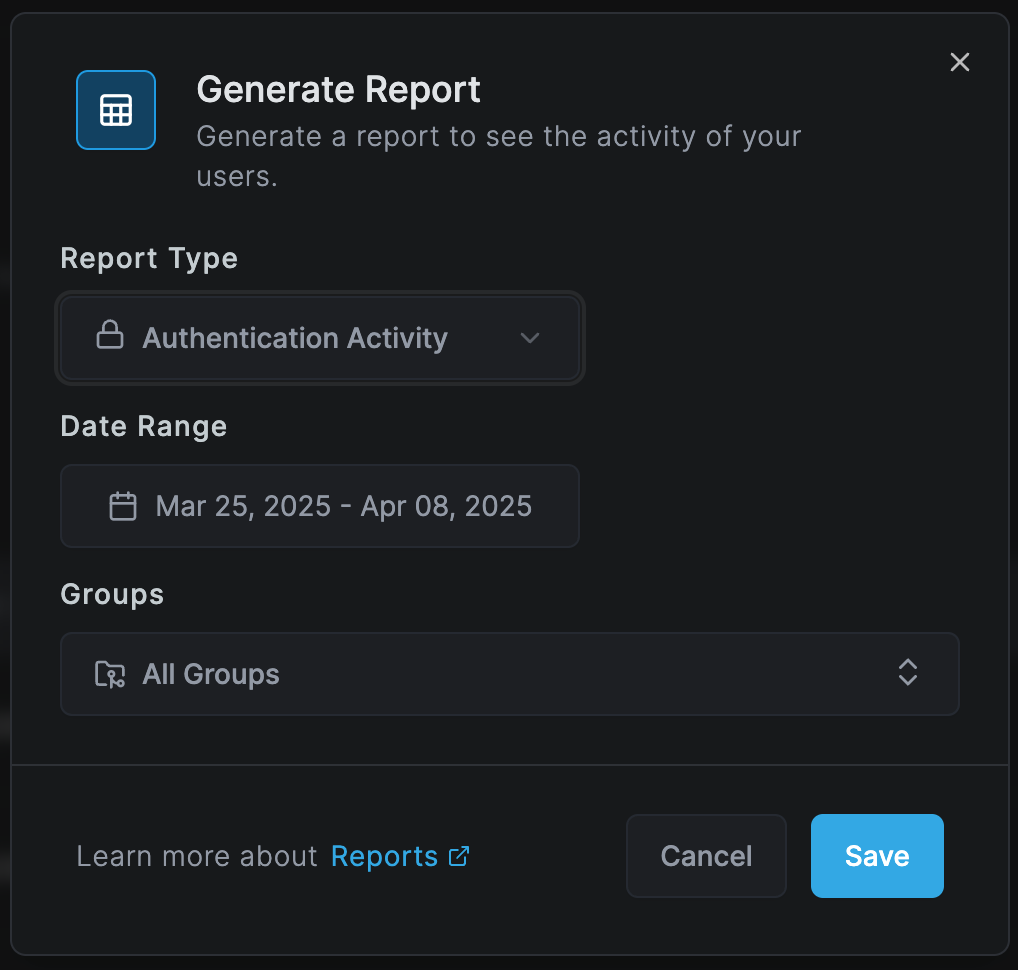
To generate a new report:
- Click Create Report
- Select the Report Type (Authentication Activity, User Activity, or AI Activity)
- Choose a Date Range for the report
- Select the Groups to include or choose "All Groups"
- Click Save to generate the report
Report Actions
You can perform the following actions on generated reports:
- View: Access detailed report information and analytics
- Download: Export reports for offline analysis in various formats
- Delete: Remove outdated or unnecessary reports
- Share: Distribute reports to relevant stakeholders
Practical Use
Regularly review these reports to:
- Monitor and analyze user behaviors
- Ensure compliance with company policies
- Detect potential security risks early
- Maintain operational oversight and efficiency
This section empowers administrators to stay informed and proactive, ensuring optimal security and operational performance within Netzilo.
Getting Started
Choose a report type to begin:
- View User Activity Reports - Analyze user behaviors and interactions
- View Authentication Activity Reports - Monitor login patterns and security
- View AI Activity Reports - Track AI tool usage and compliance
Support
- Follow us on LinkedIn
- Join our Slack Channel