

Behavior Graph & Kill Chains
Netzilo records what every governed AI agent does: the models it calls, the tools it uses, the hosts it reaches, the instructions it loads and, on devices, the processes it starts and the files it touches. Each action is attributed to the session that did it. From these records Netzilo builds a behavior graph for each session.
Guardrails read this history to catch attacks that no single request reveals, such as an agent that loads instructions from an unknown site, then reads a credential file, then sends data out. When such a rule fires, it attaches a kill chain: the ordered steps that led to the verdict.
You open both from Activity > Events: a Session snapshot row opens the session's behavior graph, and an AI event that carries a chain opens its kill chain.
How it works
Netzilo keeps two layers:
| Layer | What it holds | Used for |
|---|---|---|
| Observation log | One row per event: the session that produced it, its parent session, the program, the user, the device and the target | Exact attribution and order: "which session did this, and who started it" |
| Behavior graph | One node per session, program, model, tool, host or skill, with edges merged per session and target, each with a count and first and last time | Breadth: "what has this session touched, and how often" |
- An enforcement point (the Netzilo client, the browser extension or the AI Gateway) sees an action and records it as an observation.
- The observation is added to the log and folded into the behavior graph.
- Guardrails evaluate the action. Scripted guardrails can read the session's history in the log and the graph before they decide.
- Hosts upload their observations to the Netzilo Server hourly and when they stop. The browser extension uploads in small batches as it goes.
- The first time a session shows behavior, the Netzilo Server records a Session snapshot entry in Activity.
Sessions
A session is one acting instance: one run of an agent, one MCP session, one conversation, one browser tab on one site, or one process on a device. Netzilo identifies a session by the strongest key it has:
| Kind (strongest first) | Key | Where it comes from |
|---|---|---|
| Agent | the agent framework's own session id | coding-agent hooks (Claude Code, Codex CLI, Gemini CLI, OpenClaw) and agents governed by the SDK |
| MCP | the MCP session header | MCP traffic through the client or the AI Gateway |
| Conversation | a provider's conversation id | LLM traffic that carries one |
| Process | process id plus start time | a process on a device; the start time keeps a reused process id from being confused with an earlier one |
| Derived | user, client and an idle window | traffic that carries nothing better |
Sessions form a tree: a process started by an agent is a child session of the agent's session, so a rule can follow the whole run. A session ends with an explicit end event, or after 30 minutes without activity.
In the browser, each tab on a site is a session of its own, under a session for the browser.
What each enforcement point records
| Activity | Netzilo client on a device | Browser extension | AI Gateway |
|---|---|---|---|
| Session start and end | yes | yes | yes |
| LLM requests and responses | yes | yes | yes |
| Tool calls and results, MCP | yes | yes | yes |
| HTTP requests | yes | yes, except Safari | yes |
| Skills (instructions an agent loaded) | yes | yes | yes |
| Processes started | yes | no | no |
| File activity | yes | no | no |
| Outbound connections | yes | no | no |
Process, file and connection activity on a device comes from the endpoint probe and, for agents you build, from the SDK's advanced governance on Linux. The gateway never sees processes, files or connections.
Open a session snapshot
- Go to Activity > Events.
- Open All Event Types and select Session snapshot.
- On a row, click the eye icon, View behavior graph.
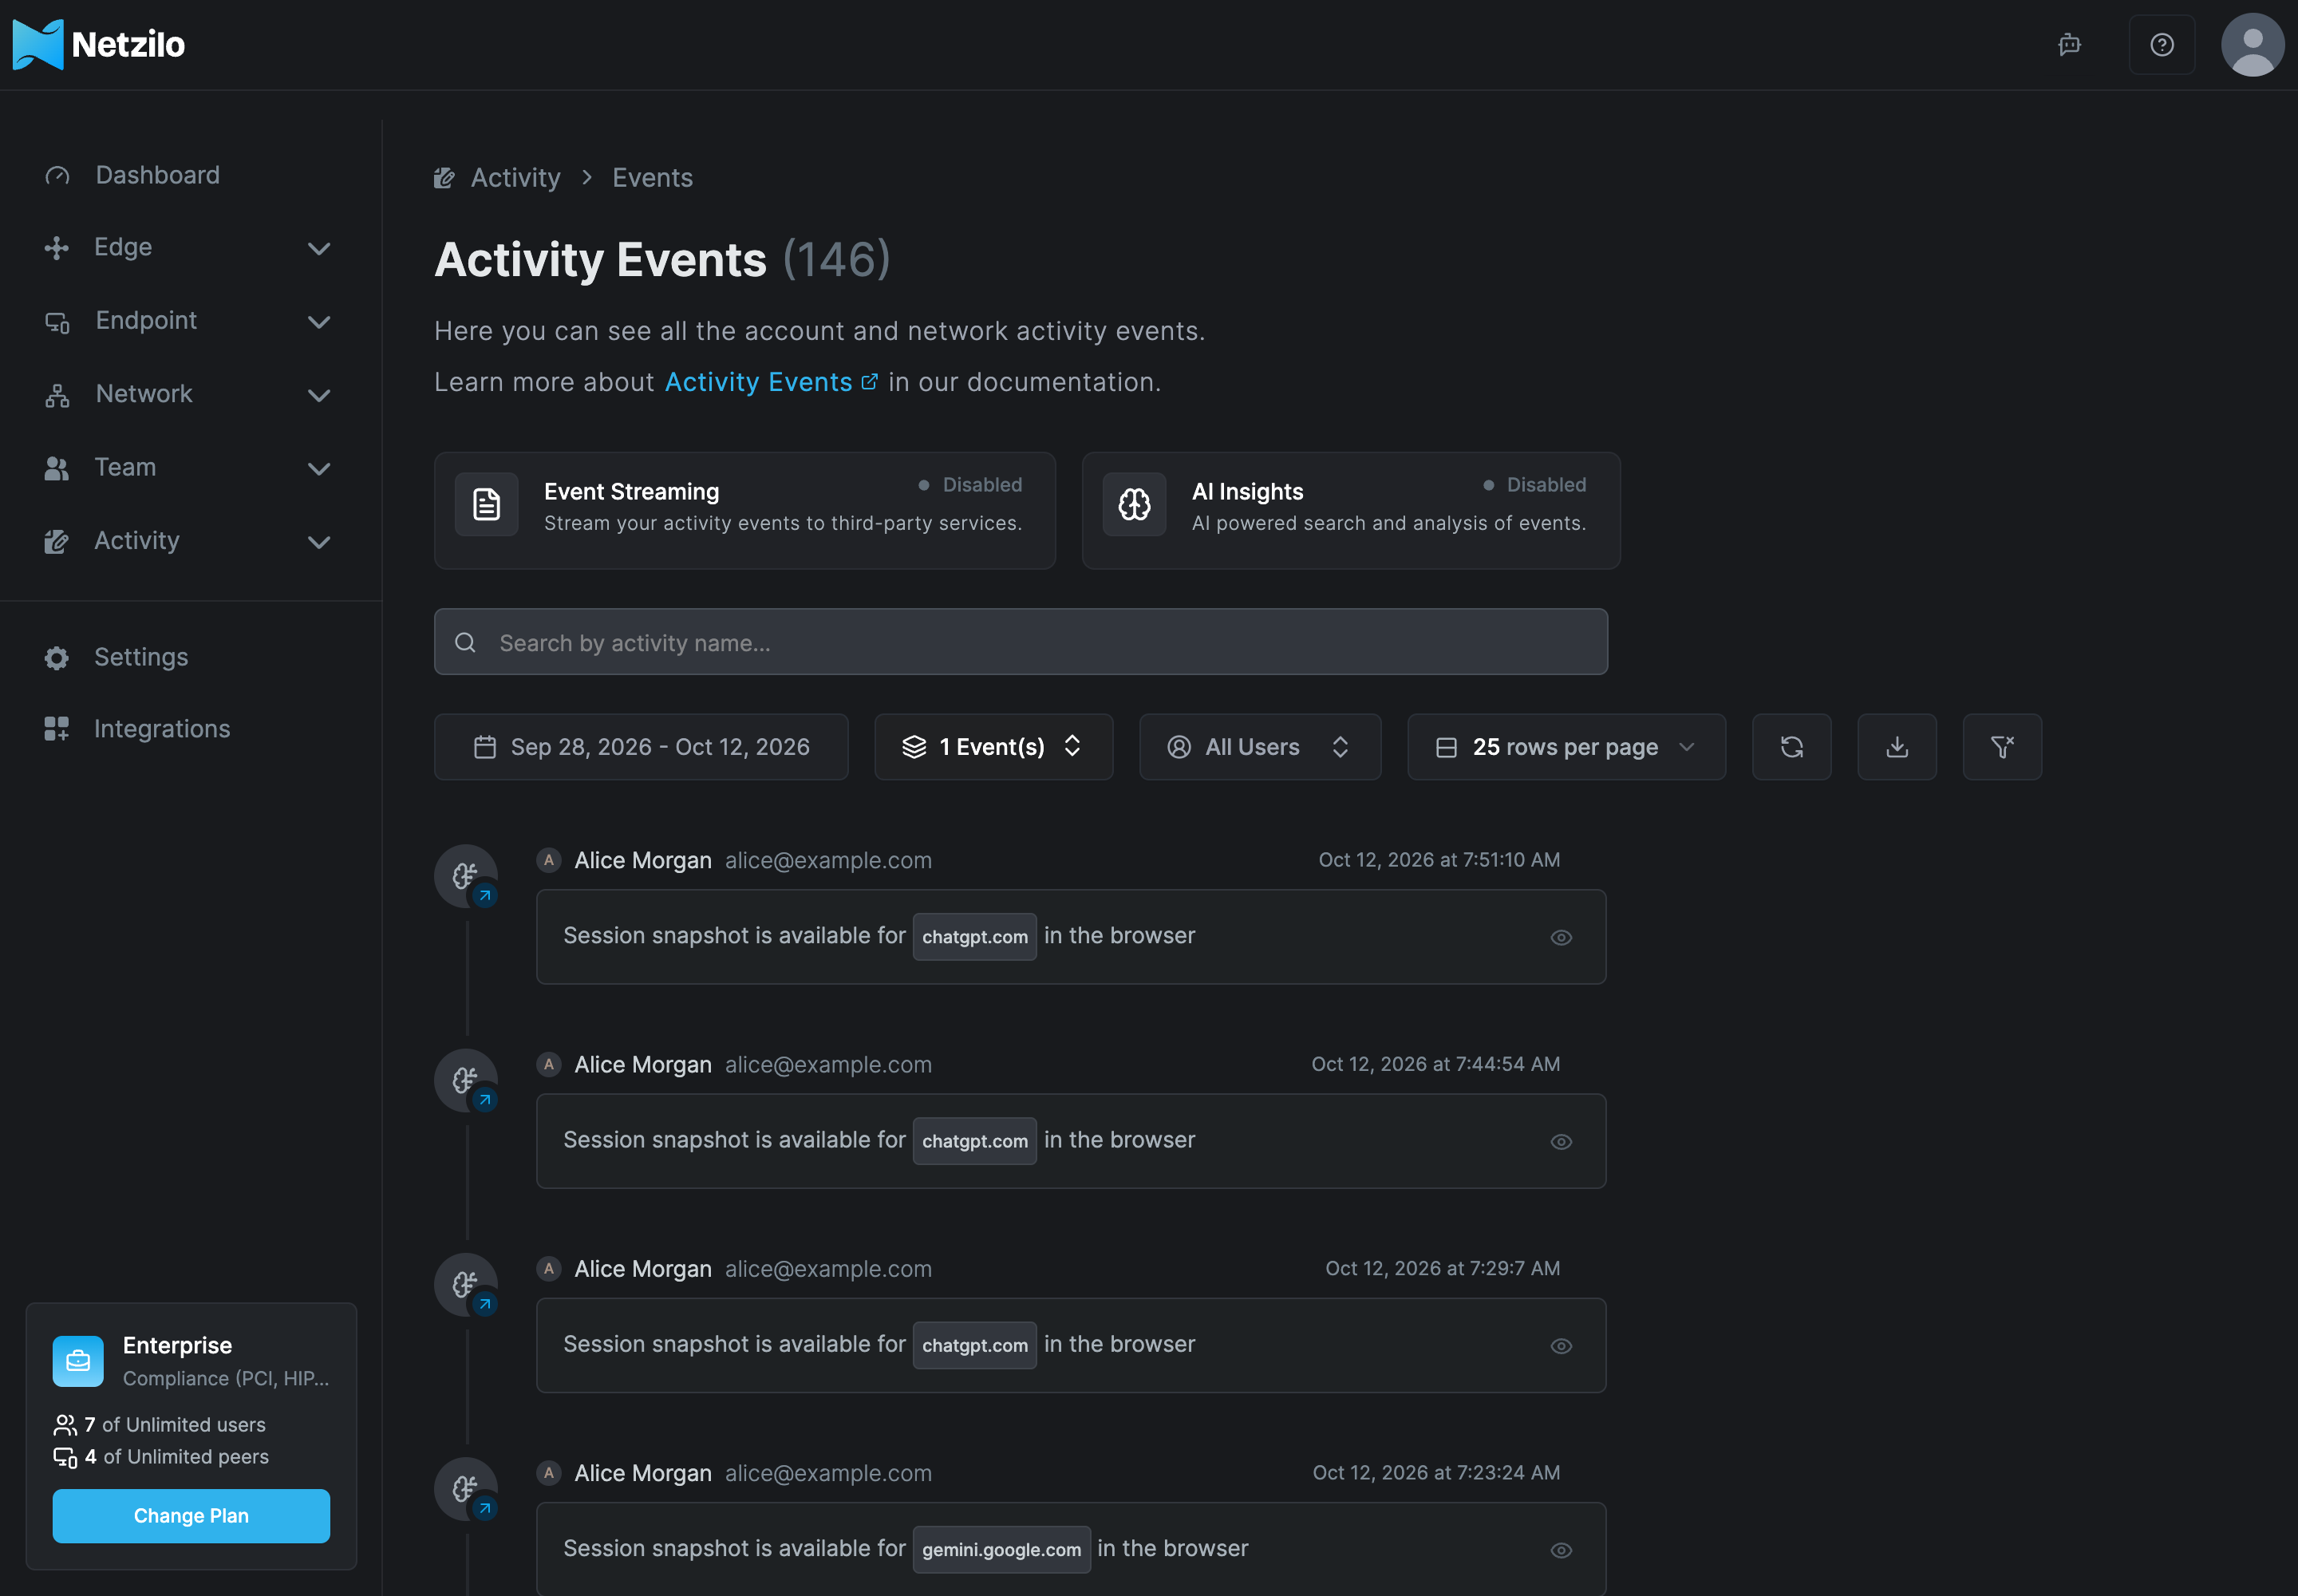
A device row reads "Session snapshot is available for peer <peer>"; a browser row reads
"Session snapshot is available for <site> in the browser".
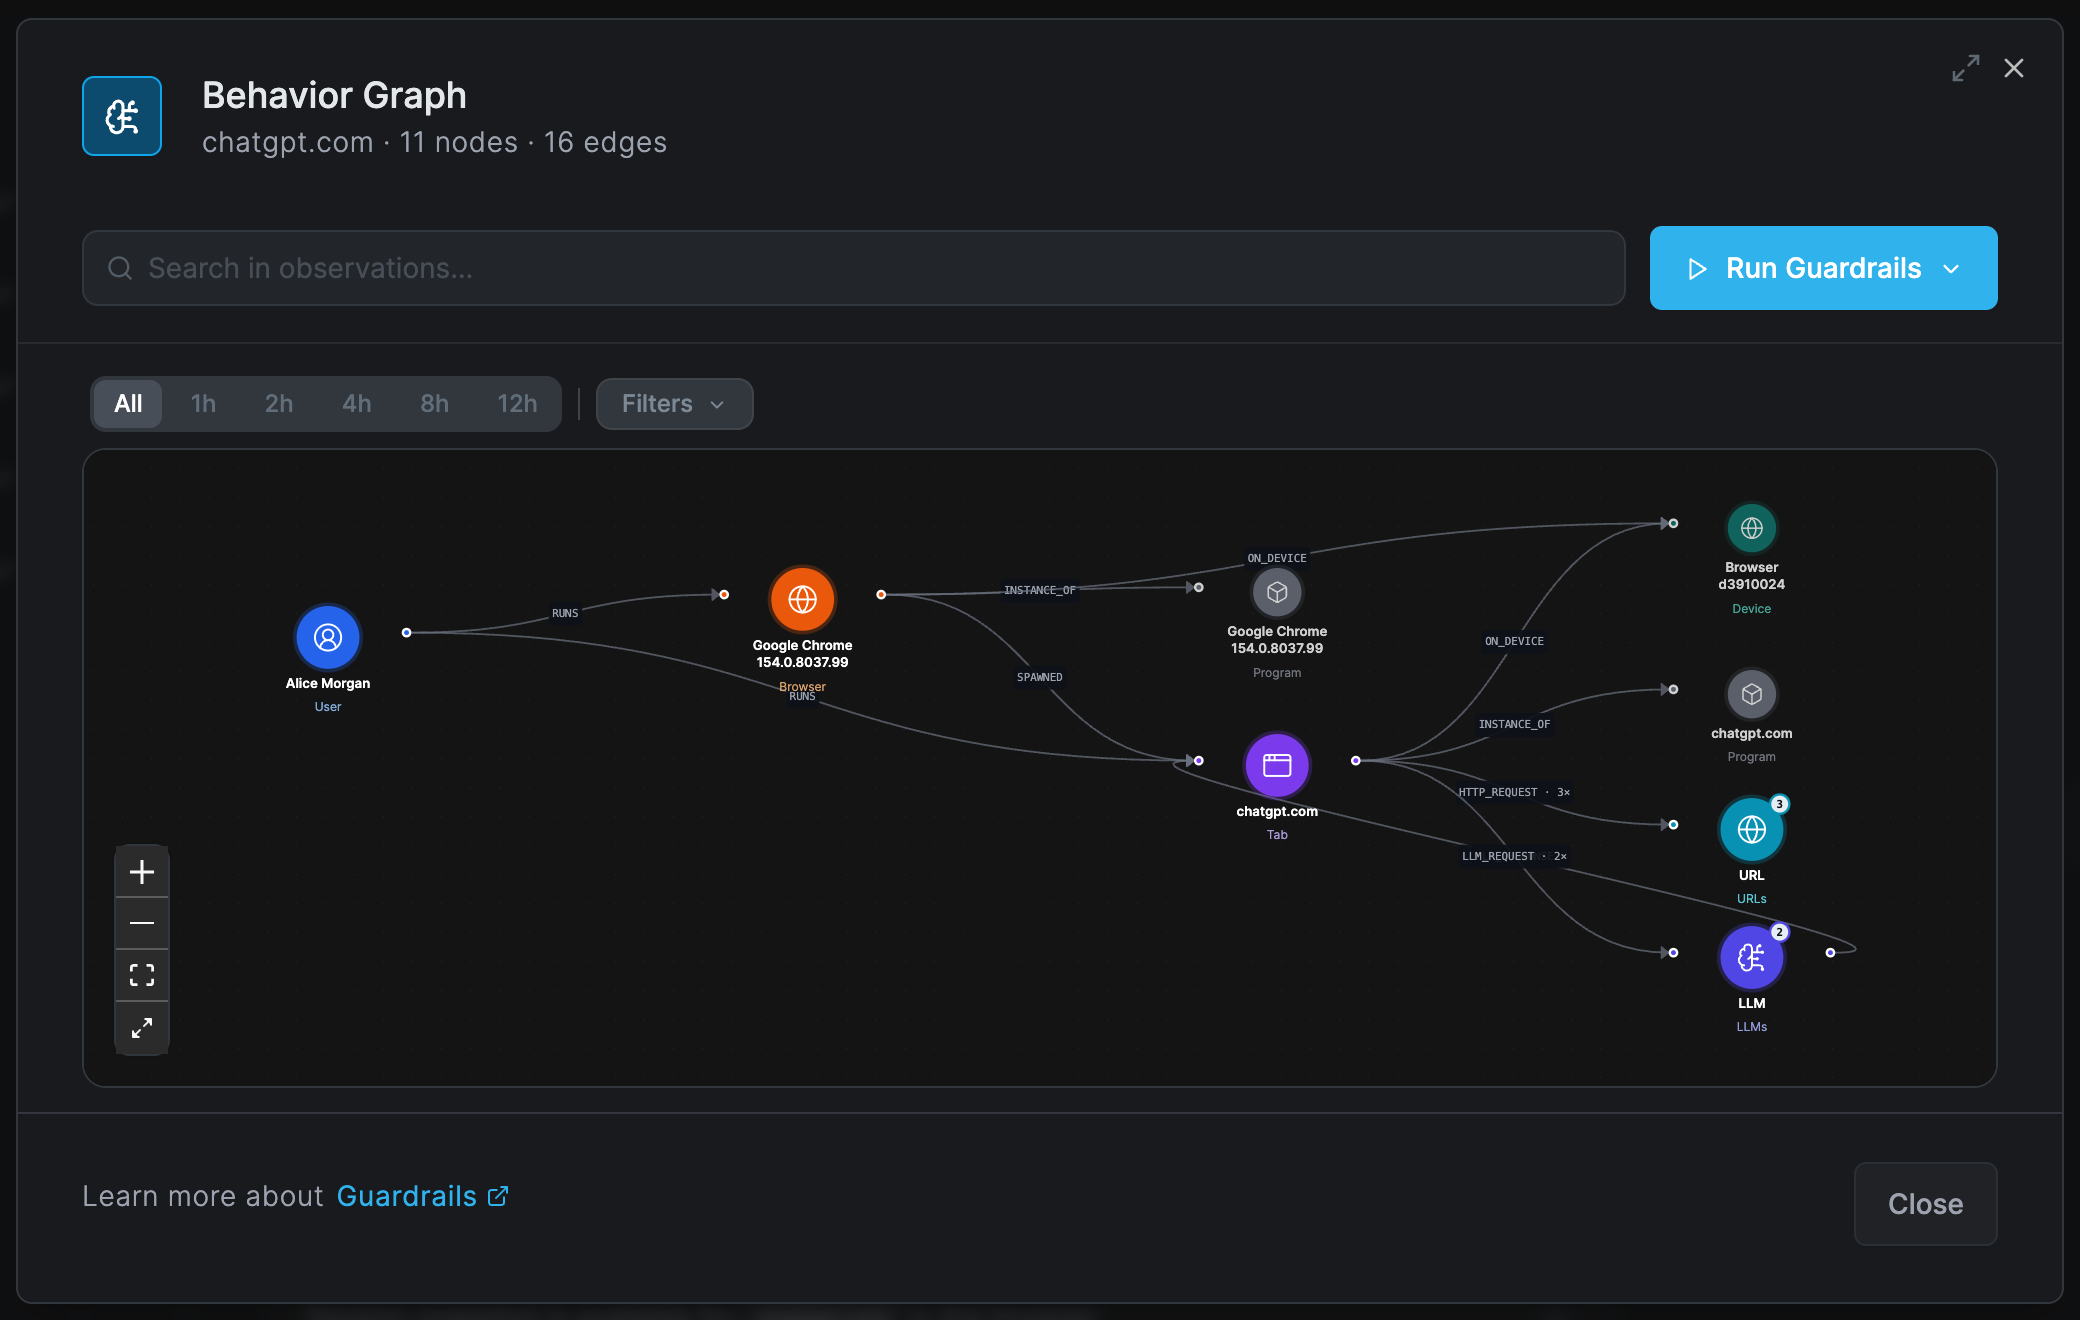
The Behavior Graph dialog opens with the session's graph:
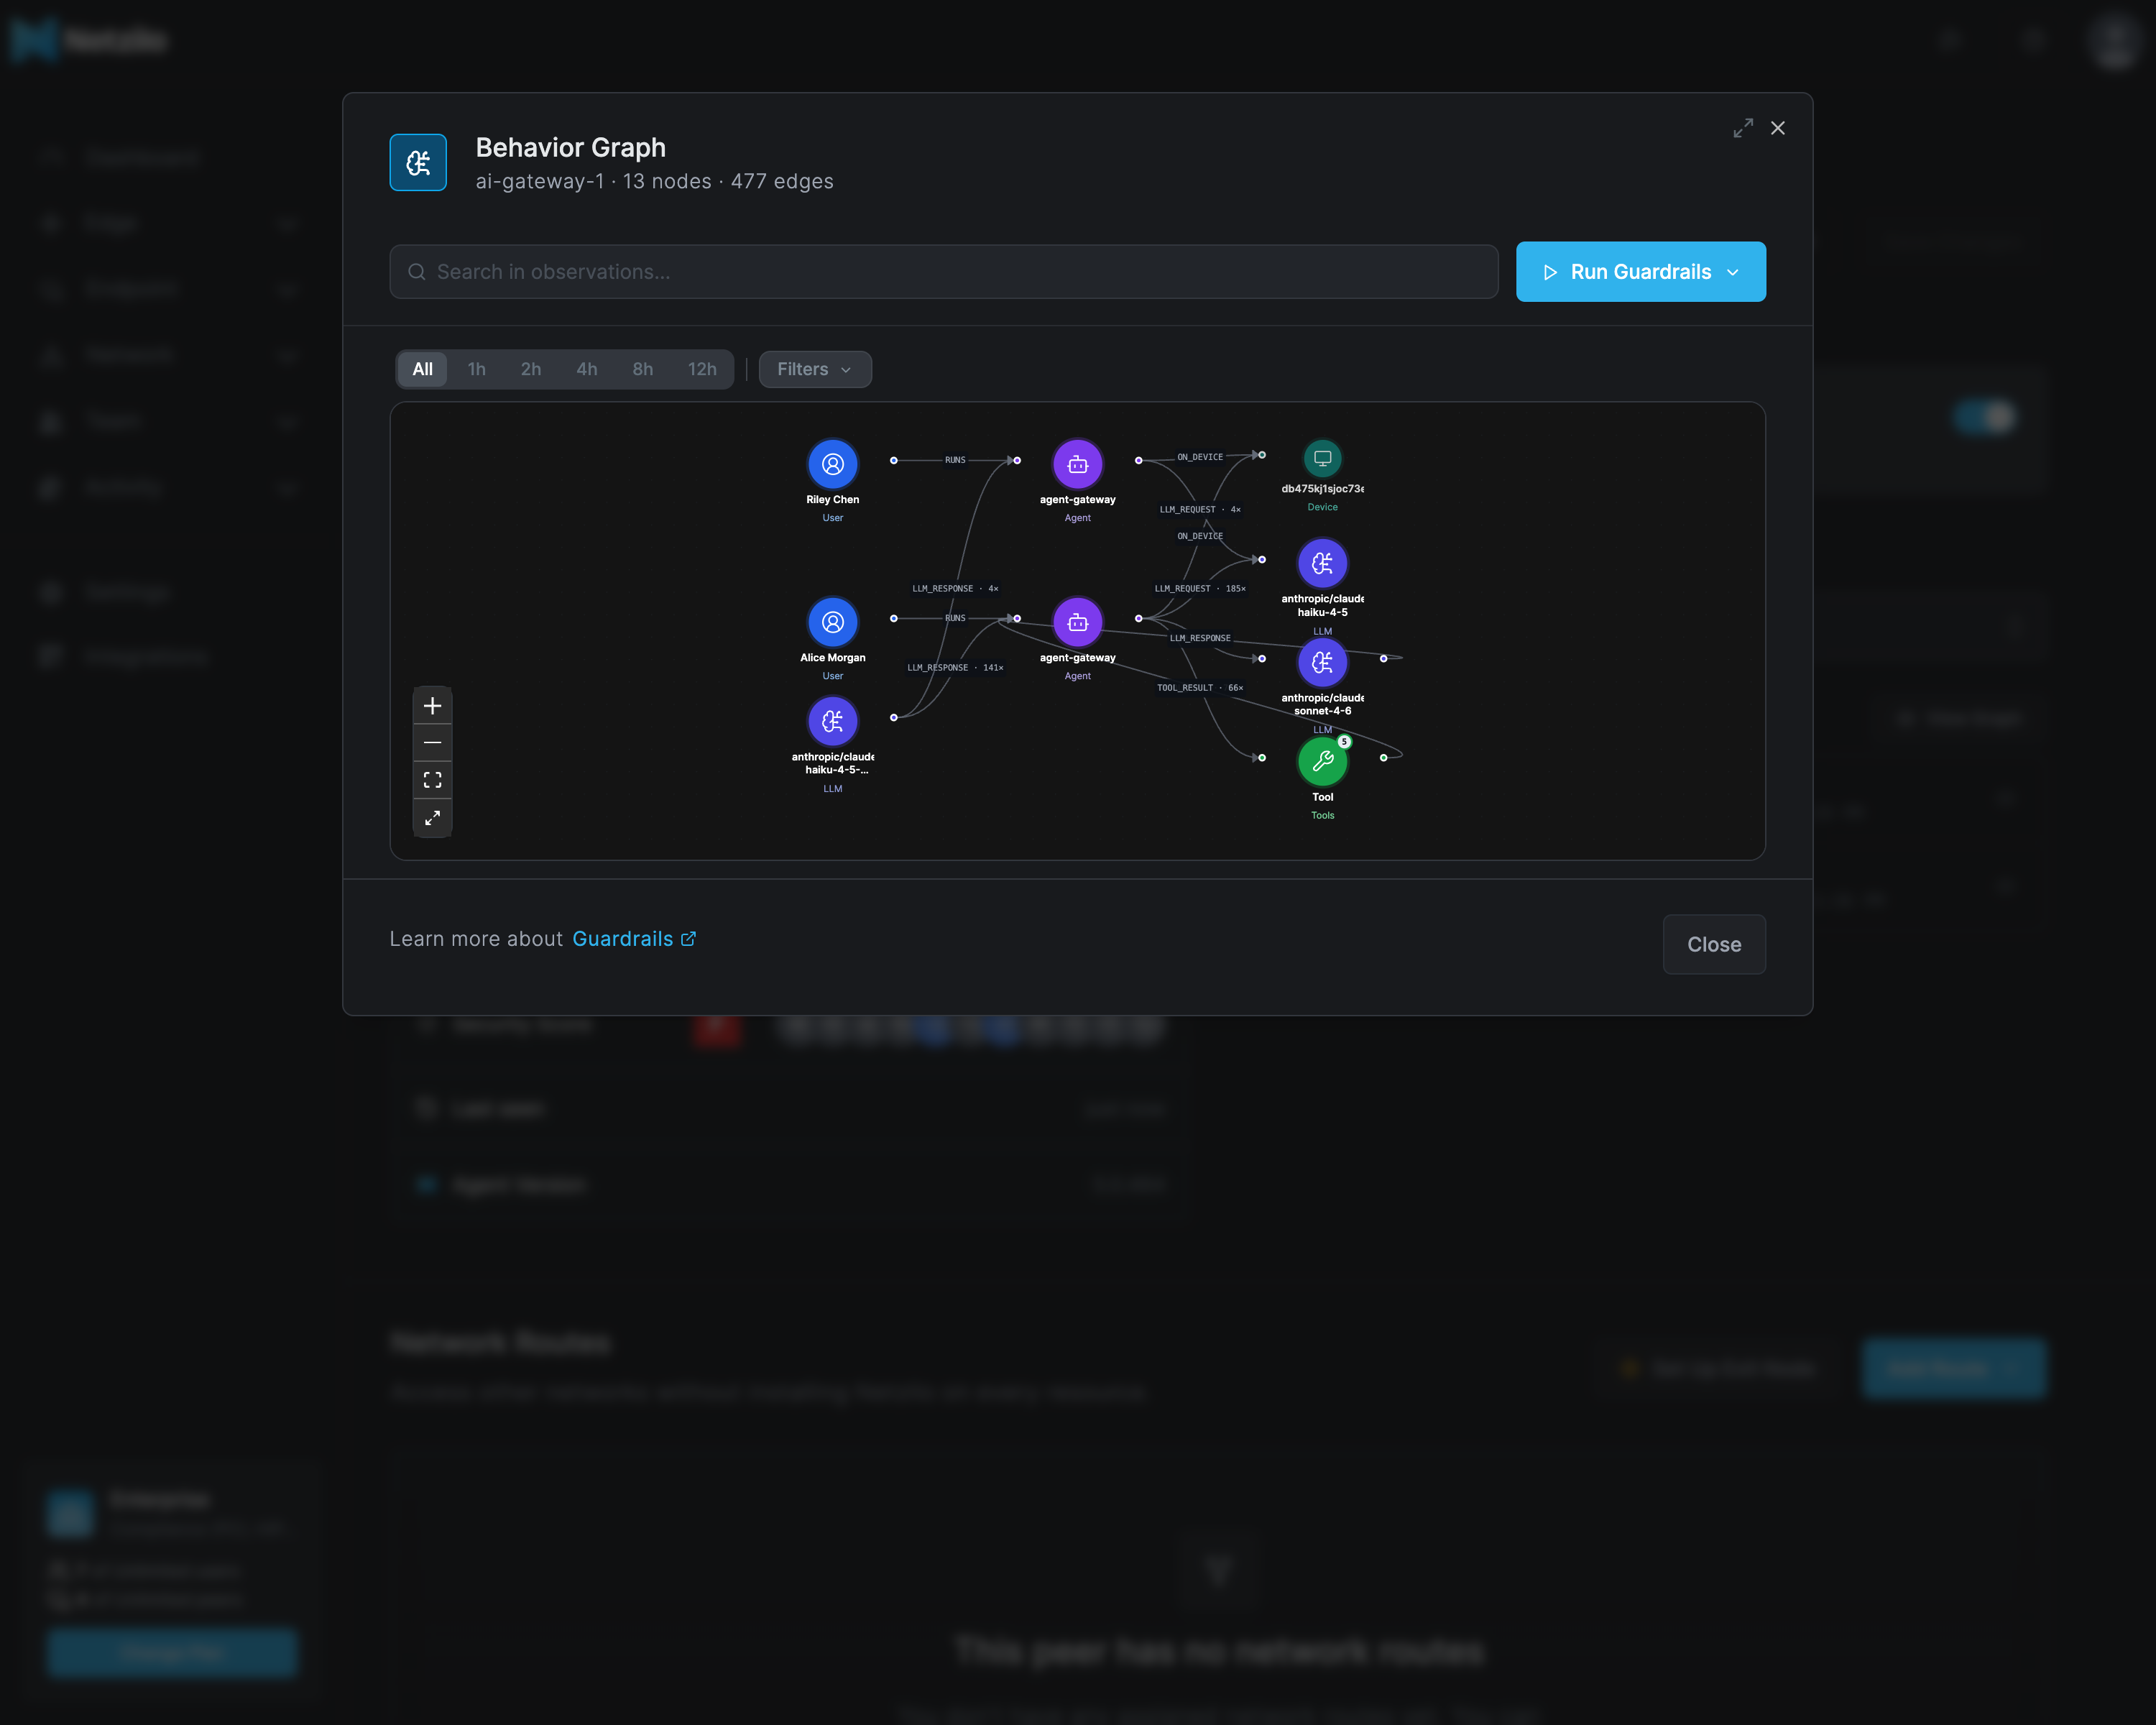
You can also open the sessions of one device from its peer page: Endpoint > Peers, open the peer, and use View Graph in the Behavior Sessions panel.
Read the graph
Nodes. Each node type has its own color in every graph view.
| Node | What it is |
|---|---|
| User, Agent | The Netzilo user, or the agent identity (such as a service user) the session acts for |
| Session | One acting instance; in the browser it shows as Browser or Tab |
| Program | What a session runs as: an executable path on a device, a client name at the gateway, or a site in the browser |
| Device | The peer, or the browser when it runs on no enrolled device |
| LLM | A provider and model |
| Tool | An MCP or agent tool, with its server |
| URL | A host the session sent HTTP requests to |
| Host | A raw TCP or UDP destination (devices only) |
| Skill | An instruction document the agent loaded |
| FileSystem | All file activity of one session (devices only); the file paths are in the observation log |
Edges. RUNS (user to session), INSTANCE_OF (session to program), ON_DEVICE,
SPAWNED (a session started another one), LLM_REQUEST and LLM_RESPONSE, TOOL_CALL and
TOOL_RESULT, HTTP_REQUEST and HTTP_RESPONSE, CONNECTS, ACQUIRED_SKILL, and the
file edges READ_FILE, WRITE_FILE, CREATE_FILE, DELETE_FILE and RENAME_FILE. A label
such as HTTP_REQUEST · 3× shows how often an edge was seen.
Clusters. When several nodes of one type share the same parent, they are grouped into one node with a count badge, for example URL with the badge 3.
Toolbar. Pick a time window (All, 1h, 2h, 4h, 8h, 12h) and use Filters to show or hide node and edge types. Use the zoom buttons or the fullscreen button for large graphs.
Search. Type in Search in observations… to find observations, or click a node or an edge to list what it holds.
Run Guardrails. Choose guardrails and click Run Selected to replay them against this session's observations. The results show how many observations were blocked, redacted, detected or left unchanged, with each rule's output. This runs nothing on the device. See Guardrails.
Kill chains
A kill chain is the ordered list of steps that led a scripted guardrail to its verdict, from the session that owns the attack to the action that triggered the rule. The rule author labels each step with an attack stage, such as "Initial Access" or "Credential Access", and a reason. Netzilo adds the context in front of the first step: the user and the chain of sessions that started the attacking session.
To open one, find the AI event in Activity > Events, for example an AI blocked or AI detected event from a scripted rule, and click the eye icon, View kill chain. The Kill Chain dialog shows:
- the steps in order, each colored by its stage and annotated with the stage name and the reason the rule gave;
- the action that triggered the rule, ringed in grey and labelled Trigger Reason, which is separate from the stage colors;
- for file steps, the exact files; long lists collapse behind show all.
Only events from rules that build a chain have the View kill chain action. Content rules that match one prompt or one tool call do not need one. Writing a rule that returns a chain is described in Detection Rules.
Who sees what
- Administrators see every session in the account.
- Regular users see the sessions of their own devices and their own browsers.
- Observations are kept for 7 days on the Netzilo Server. Activity events are kept like every other event.
What is stored
Observations record what happened, not what was said: the model, the tool, the host, the sizes and the identities, but not the prompt or answer text. Text leaves the device, the browser or the gateway only when a guardrail matches, as part of that event. Treat session snapshots as containing user activity during a security review.
For analysts: the API
The same data is available through the REST API with an administrator's token, see Agents:
| Request | Returns |
|---|---|
GET /api/aidr/sources | The devices, gateways and browsers that uploaded observations |
GET /api/aidr/sessions?scope=source:<peer id> | The sessions of one source |
GET /api/aidr/graph?scope=… | The behavior graph for a scope |
GET /api/aidr/observations?scope=session:<session id> | The observation rows of a session |
GET /api/aidr/detections?scope=… | The detections recorded for a scope |
GET /api/aidr/search?q=<text> | Matching observations |
POST /api/aidr/replay | Runs rules against stored observations; for administrators and service users |
A scope is account, source:<id>, actor:<actor id> or session:<id>. All read requests
take since and until.
Netzilo used to key the behavior graph by process. Graphs with Process nodes and
EXECUTE_PROCESS edges, and the per-peer /api/peers/{id}/aidr-snapshot endpoints,
are gone. Sessions, programs and SPAWNED edges replace them. Rules written for the old
model need the changes listed in
Detection Rules.
Troubleshooting
No Session snapshot rows appear
No governed session has shown behavior yet, or the enforcement point is not governed by a filter. Check that the device or the user is in an enabled filter under Edge > Filters, and remember that hosts upload hourly.
The graph is missing the last few minutes
Devices upload observations hourly and when they stop. Look again after the next upload.
A session shows no file or process activity
The session ran in the browser or through the AI Gateway, which never record files or processes, or the device has no endpoint probe.
View kill chain is missing on a blocked event
The rule that blocked is a content rule, or its script returned no chain.
Related Documentation
- AI Detection & Response - The enforcement points and the policy objects
- Detection Rules - Write rules that read sessions and build kill chains
- Guardrails - Create, test and replay guardrails
- Browser Extension - Tab sessions in the browser
- Events - Filter the activity log
- Peers - The Behavior Sessions panel on a peer