

Dashboard
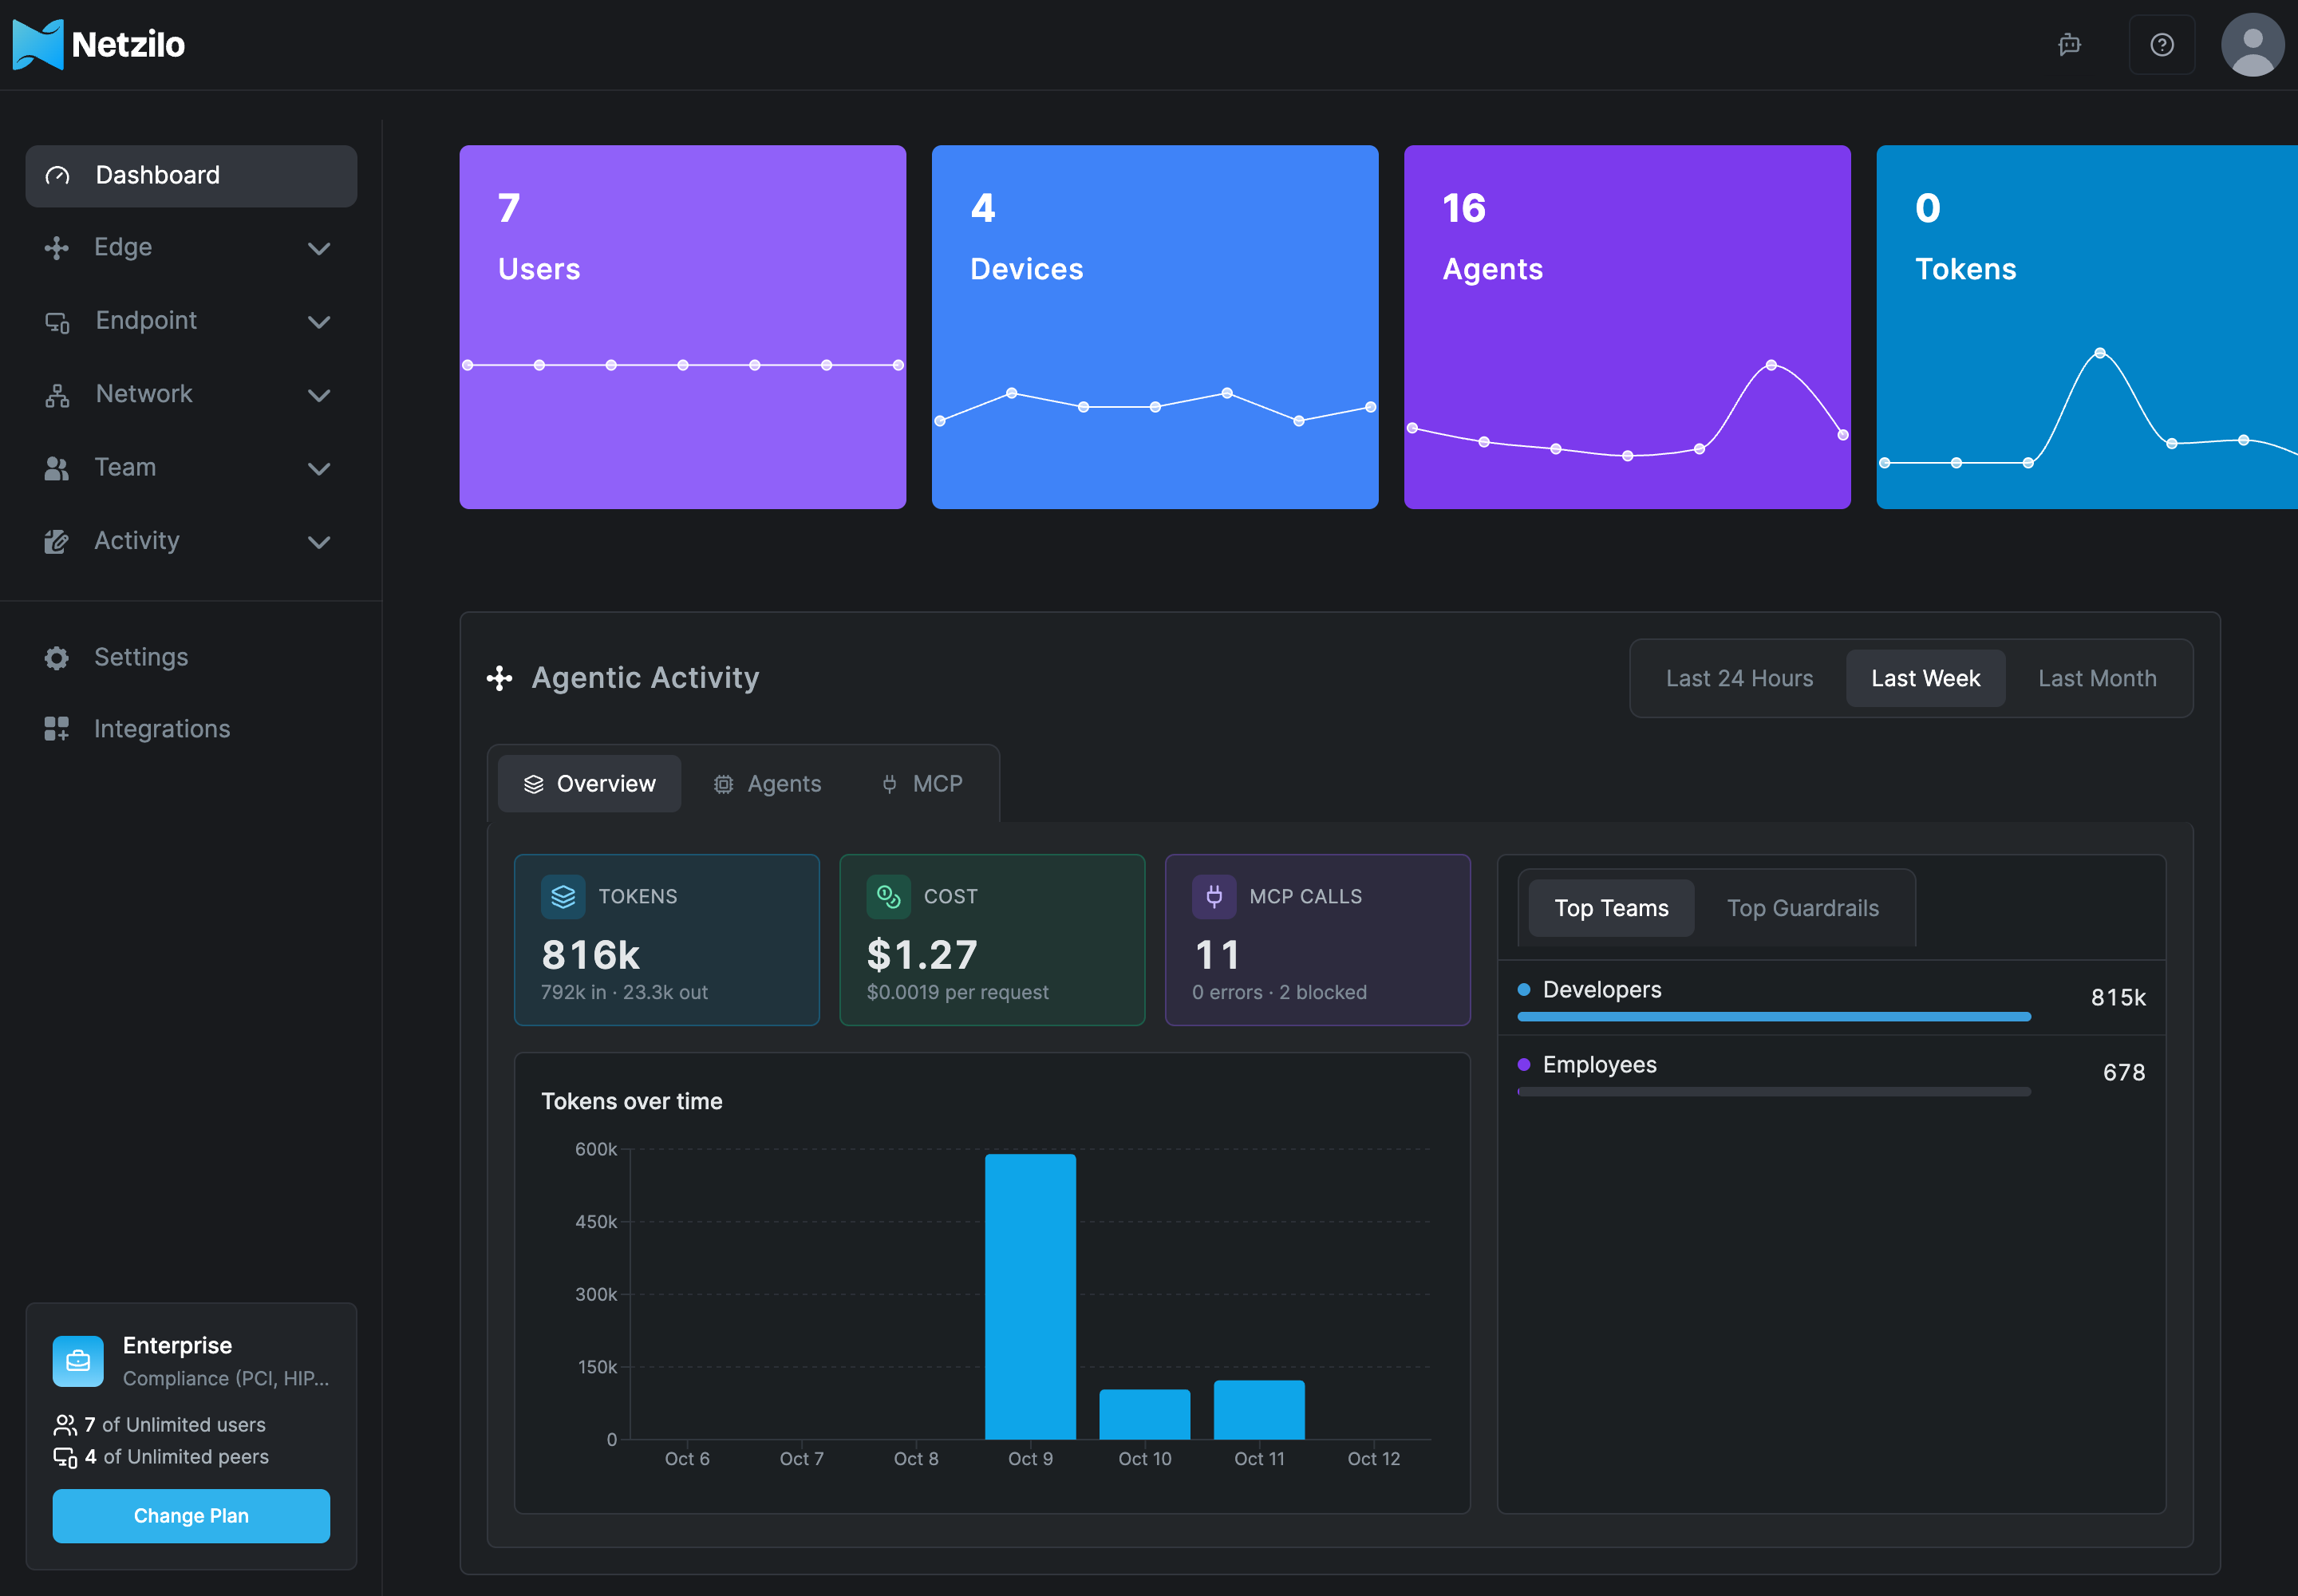
The Dashboard is the administrator's home page and the first entry of the sidebar. It answers three questions at a glance: how many users, devices and AI agents the account has, how the company's AI agents use AI on devices and through the Netzilo AI Gateway, and which operating systems and security scores the devices have.
Only administrators and owners see the Dashboard. Regular users land on the Workplace.
How it works
The Dashboard shows a snapshot that Netzilo Server computes once an hour; the Agentic Activity window shows views it builds every 15 minutes. A request made a minute ago is on neither until they are built again. To build both now, click Refresh (the circular arrows) on the Agentic Activity panel or in the window. For live numbers, generate an AI Usage report.
The window's Sessions tab is the exception: it reads the sessions live and reads them again every 30 seconds while it is open.
Tiles
Four tiles sit at the top. Each shows a total and a line for the last seven days; hover over a point to see that day's value.
| Tile | Counts |
|---|---|
| Users | Users of the account |
| Devices | Devices (peers) of the account |
| Agents | Distinct AI agents active in the last 7 days |
| Tokens | Tokens recorded per day, by the AI Gateway and by Netzilo clients that record AI sessions |
Agentic Activity
Agentic Activity summarises the AI sessions recorded on devices and on the AI Gateway. Choose the period with Last 24 Hours, Last 7 Days or Last 30 Days at the top right. Next to it, Refresh builds the numbers now and View (the two arrows) opens the Agentic Activity window.
The panel shows three cards, a top list and a chart:
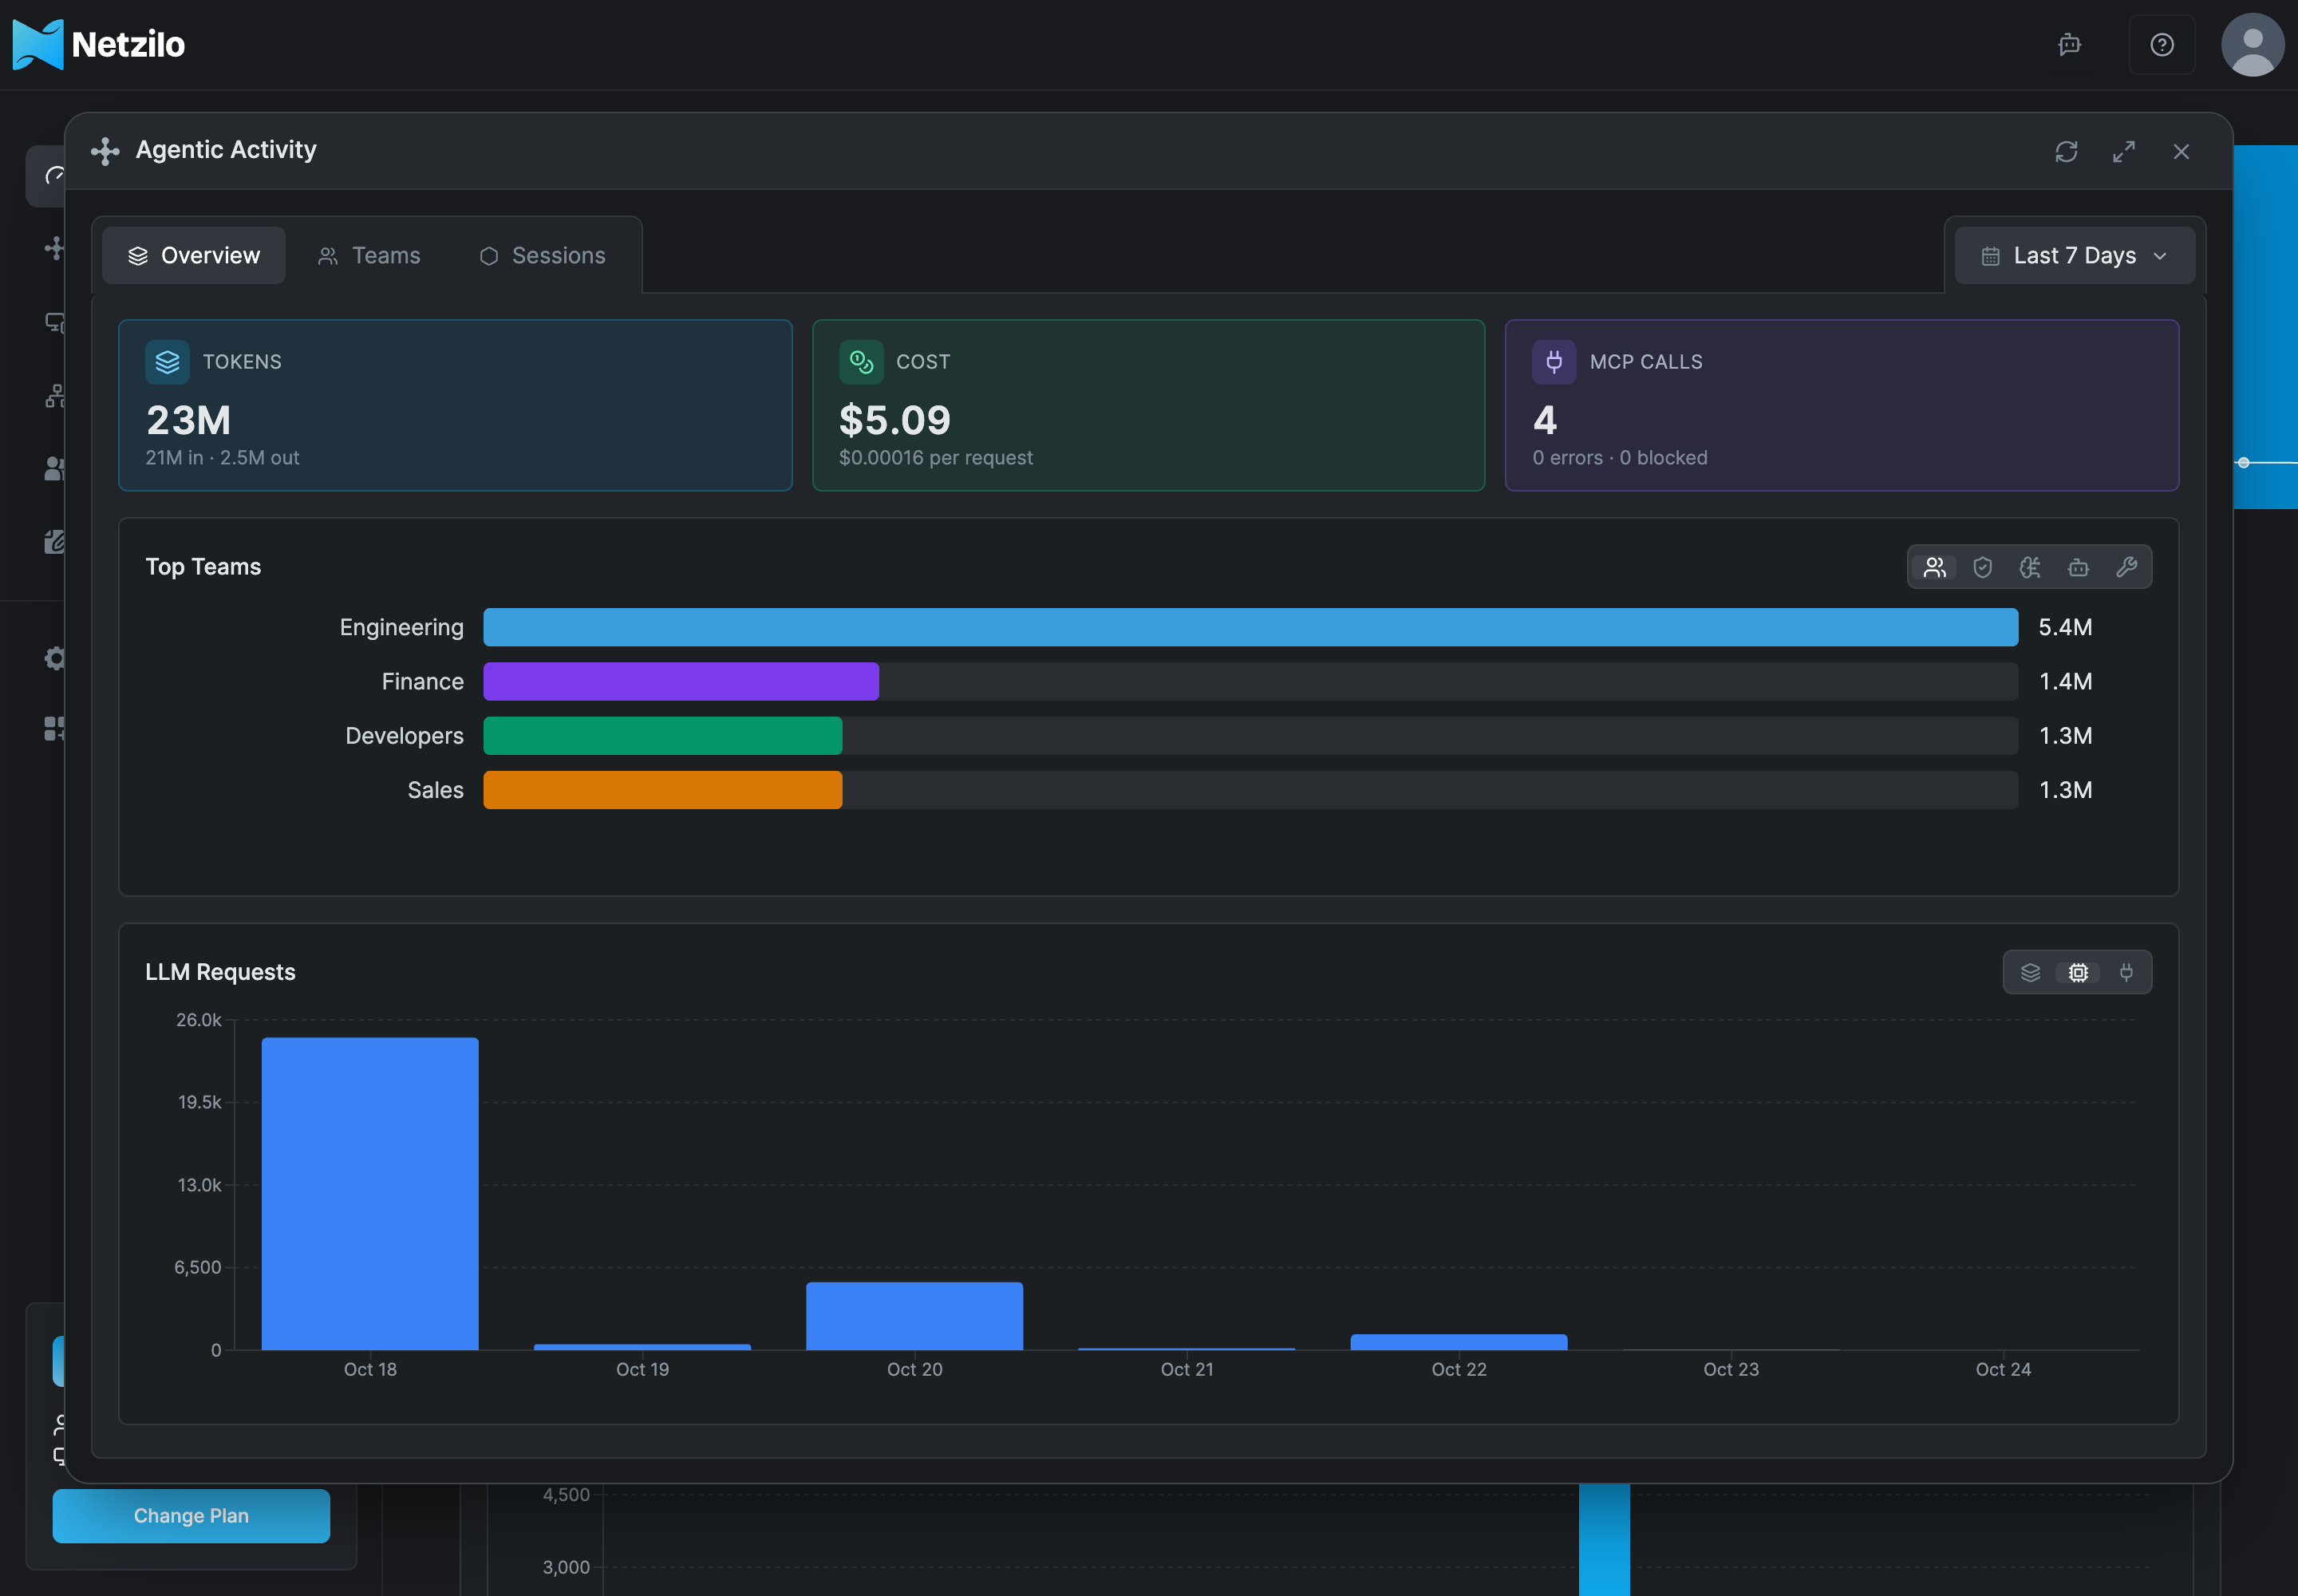
- Tokens (tokens in and out), Cost (and the cost per request) and MCP Calls (with errors and blocked calls).
- The top list, as a bar graph. Its icons pick the list: Top Teams, Top Guardrails, Top Models, Top Agents and Top Tools. Hover over an icon for its name.
- The chart over the period. Its icons pick the figure: Tokens, LLM Requests and MCP Calls.
Where the numbers come from:
- The cards and the chart count the recorded usage: the model calls and MCP calls that the AI Gateway and the Netzilo clients recorded. Browser traffic and older clients are not in them. Cost is computed for gateway traffic; calls recorded on a device count tokens at a cost of $0.
- Top Agents, Top Models and Top Tools count the calls recorded in AI sessions from every source: the Netzilo client on devices, coding-agent hooks, the browser extension and the AI Gateway. They show each one's share of the total.
- Top Guardrails counts the guardrail verdicts (AI Edge events) by rule, as shares.
- Top Teams ranks the users' groups by tokens.
- A top list shows its five largest rows.
Before there is any agent activity, the section shows Getting Started with AI Edge instead, with a Get Started with AI Edge button that opens Edge > Providers. See AI Gateway and Providers.
Refresh
Refresh builds the snapshot and the window's views now, so a request made a moment ago shows up. It takes a few seconds, longer on a busy account, and the arrows turn until it is done. Netzilo Server builds an account's numbers once at a time and at most once every 30 seconds: when several administrators click Refresh together, they all get the same build, and a click within 30 seconds of the last build shows that build.
Agentic Activity window
The View button (the two arrows) on the Agentic Activity panel opens the Agentic Activity window. It goes from the whole company down to a single agent session: the teams, a team's people, agents, models, MCP clients, servers and tools, the sessions behind each of them, and what happened in a session step by step. The sessions are those recorded on devices and on the AI Gateway.
To find a session without browsing teams, use AI Sessions under Activity: it lists every recorded session and opens it in this window.
The first page has three tabs, Overview, Teams and Sessions, with the period on the right of the tabs. Overview is the panel of the home page, filling the window.
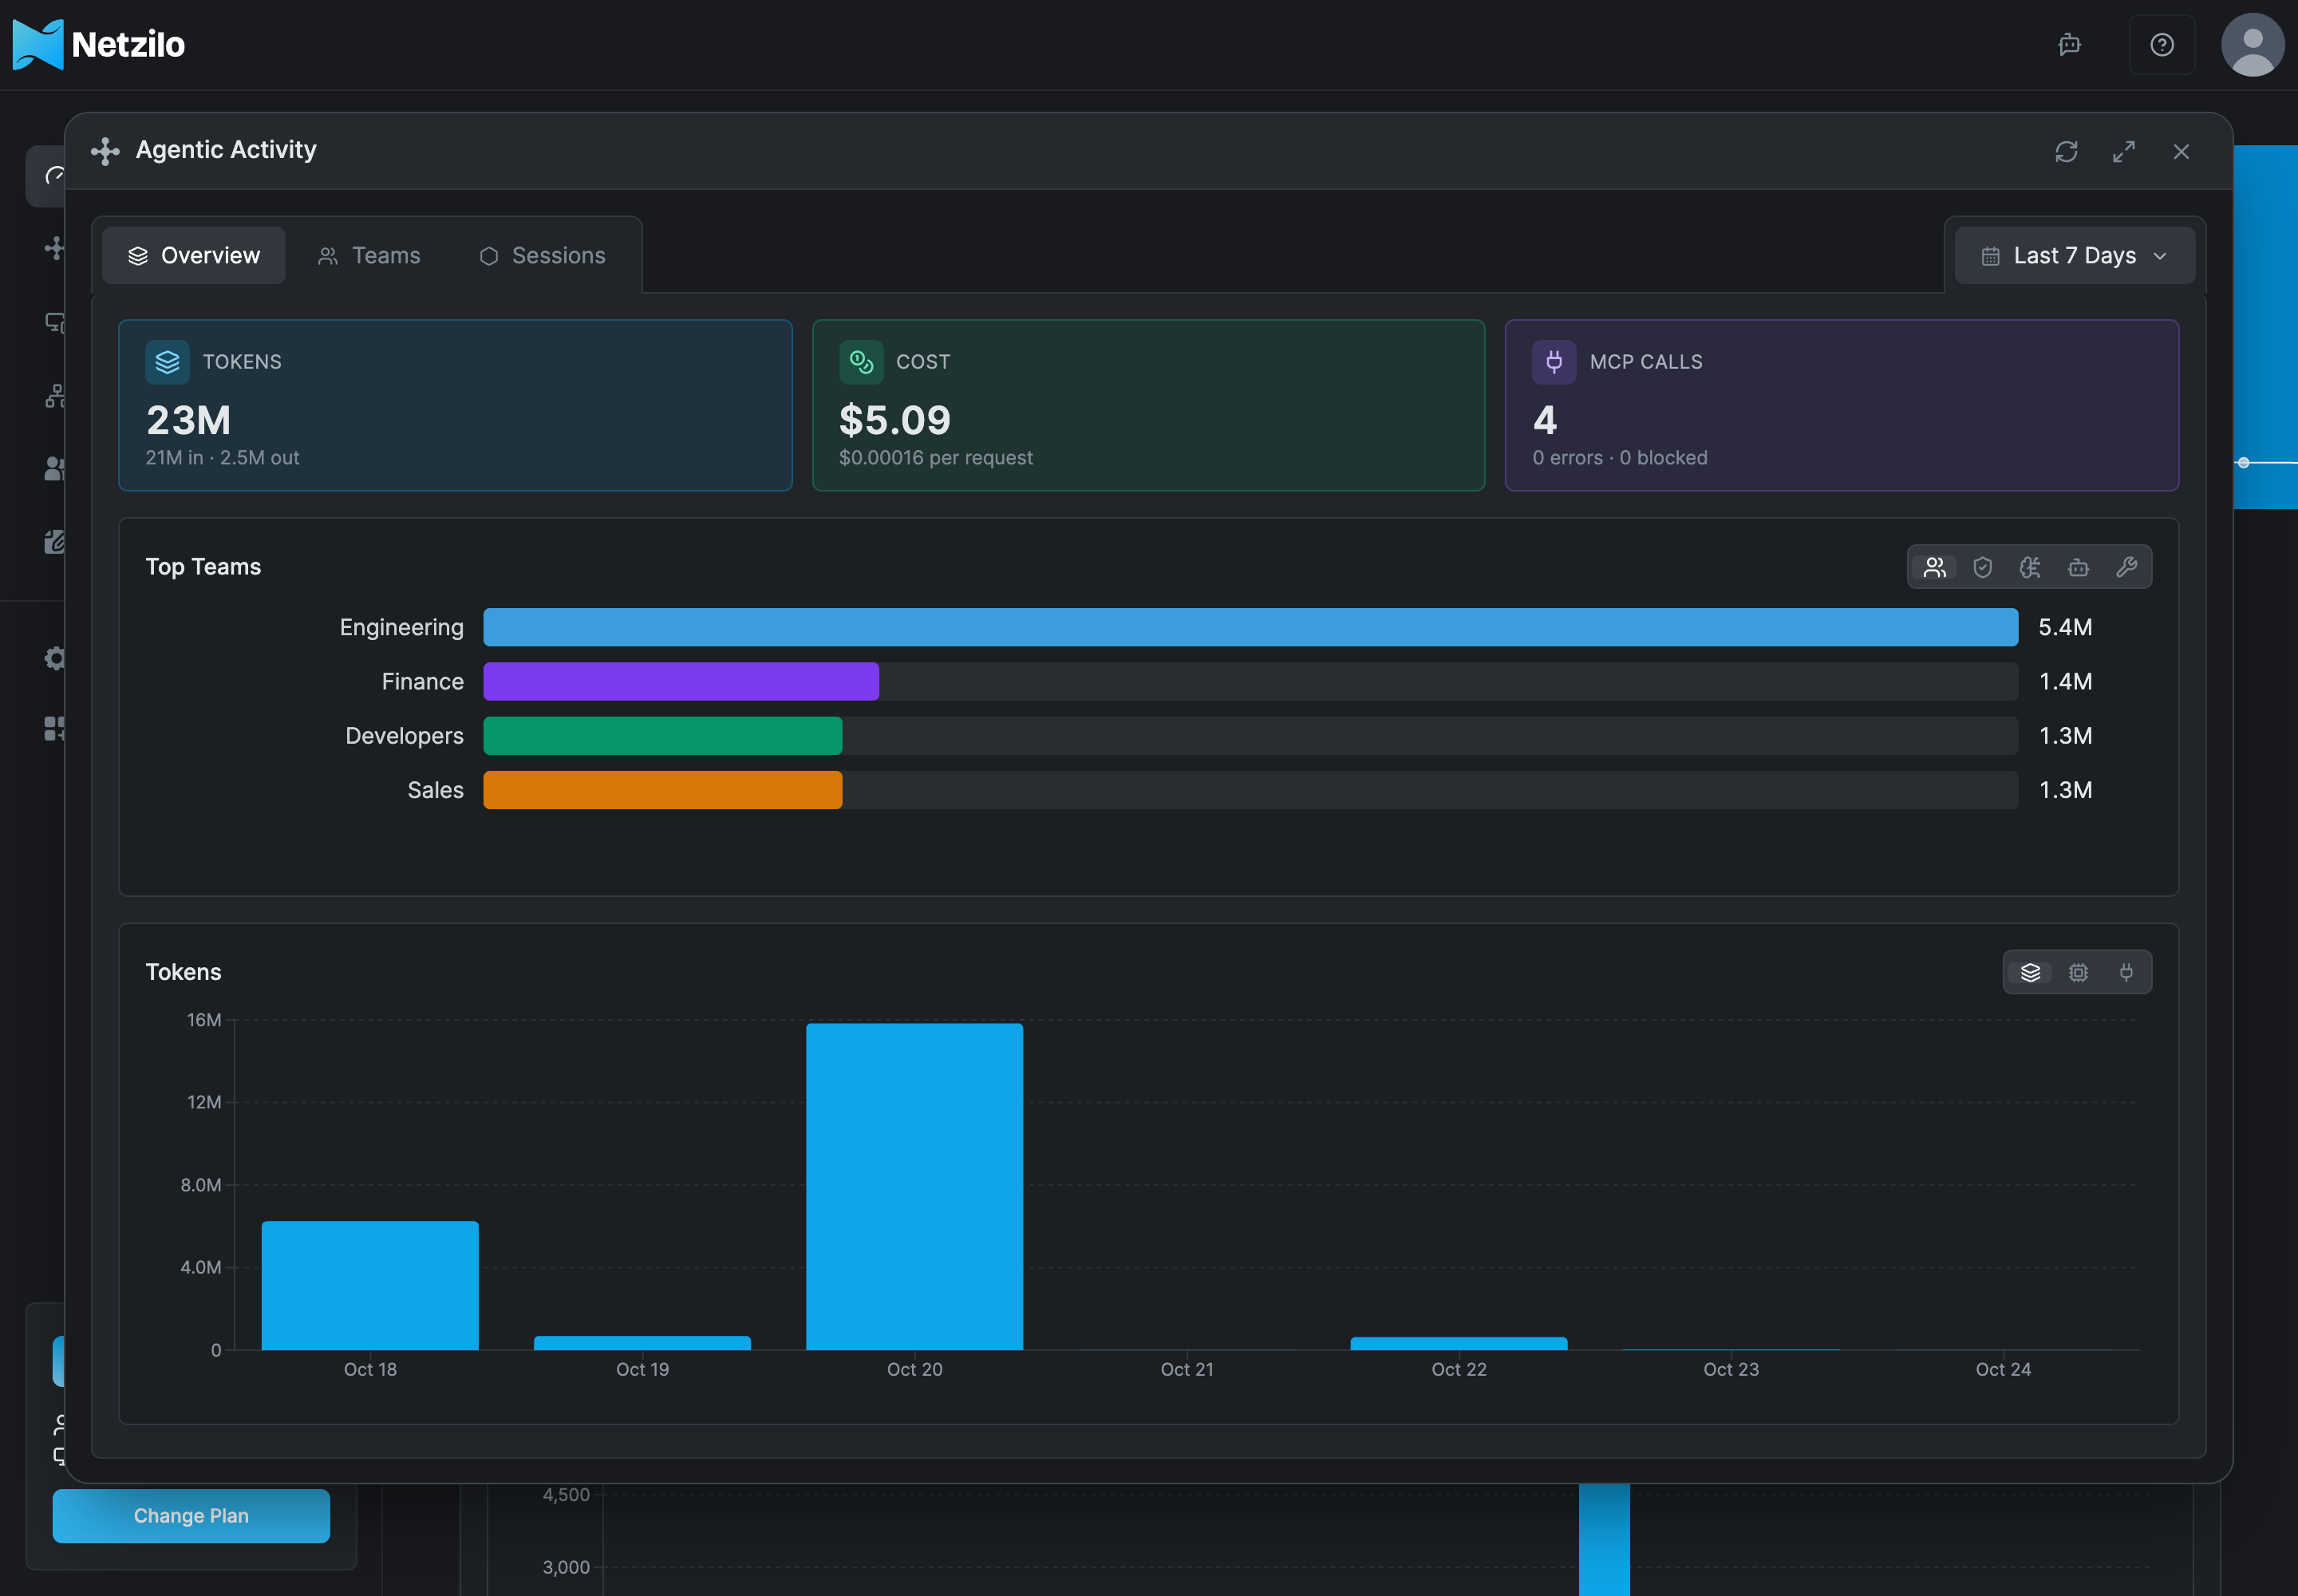
The window can be dragged, resized from any edge and maximized with the button next to Refresh. Its title names where you are, with that level's icon. The arrow at the top left, or Escape, goes back one level; Escape on the first page closes the window.
Teams tab
Teams shows a tile for each group whose members had recorded AI sessions in the period. All counts everyone.
- A tile shows the team's name, how many agents, people and service users were active, and its tokens over the period as bars. Hover over a bar for the tokens and cost of that hour or day.
- The colored bar on the left of a tile is the team's tokens against the busiest team's, from gray (few) to blue (the busiest team), as the Tokens legend shows.
- Tiles are ordered by tokens, the busiest first. More tiles load as you scroll down. Search teams finds teams by name among all of them, not only those loaded.
- Hover over a tile for its sessions, tokens, cost and violations. Violations count what the guardrails blocked, redacted or detected.
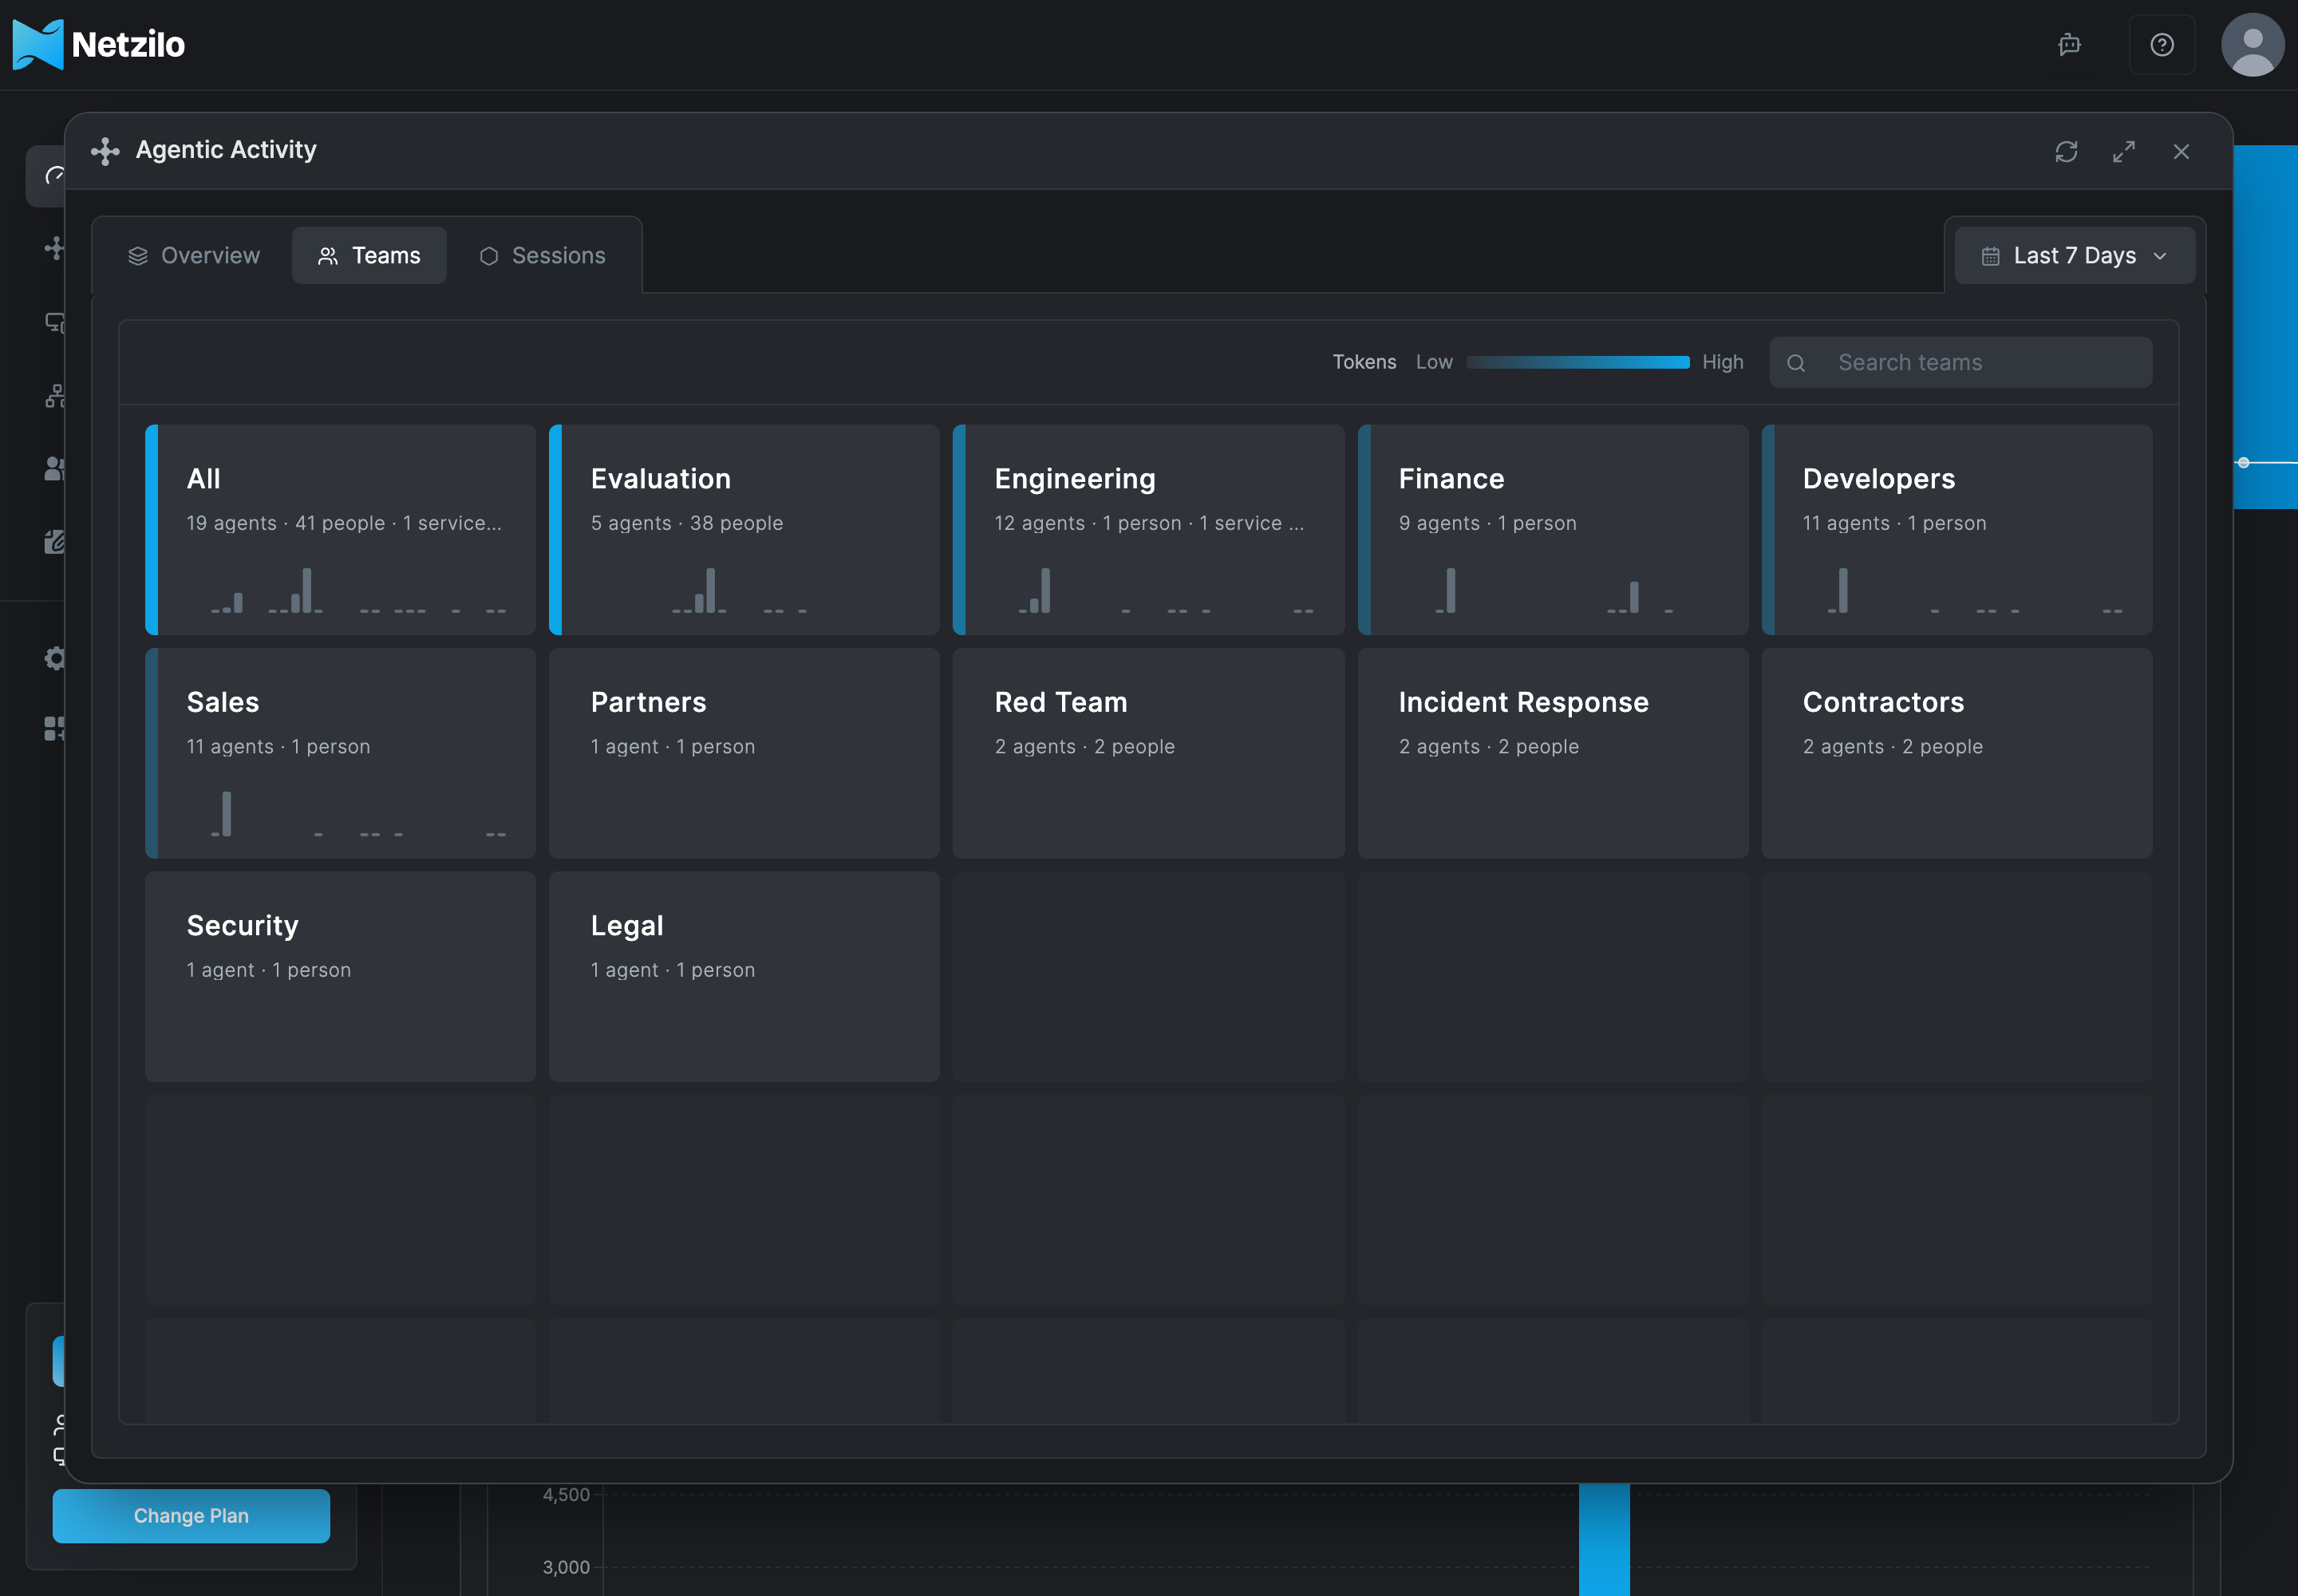
Click a tile to open the team.
A team's people, agents and models
A team opens as a flow. Traffic at the top switches between two flows:
- LLM: from the Users through their Agents to the Models, grouped by provider. The width of a band is the tokens that went that way. Hover over a name or a band for its tokens, cost and violations.
- MCP: from the Users through the MCP Clients and MCP Servers to the Tools. The width of a band is the number of calls. The MCP flow shows no verdicts.
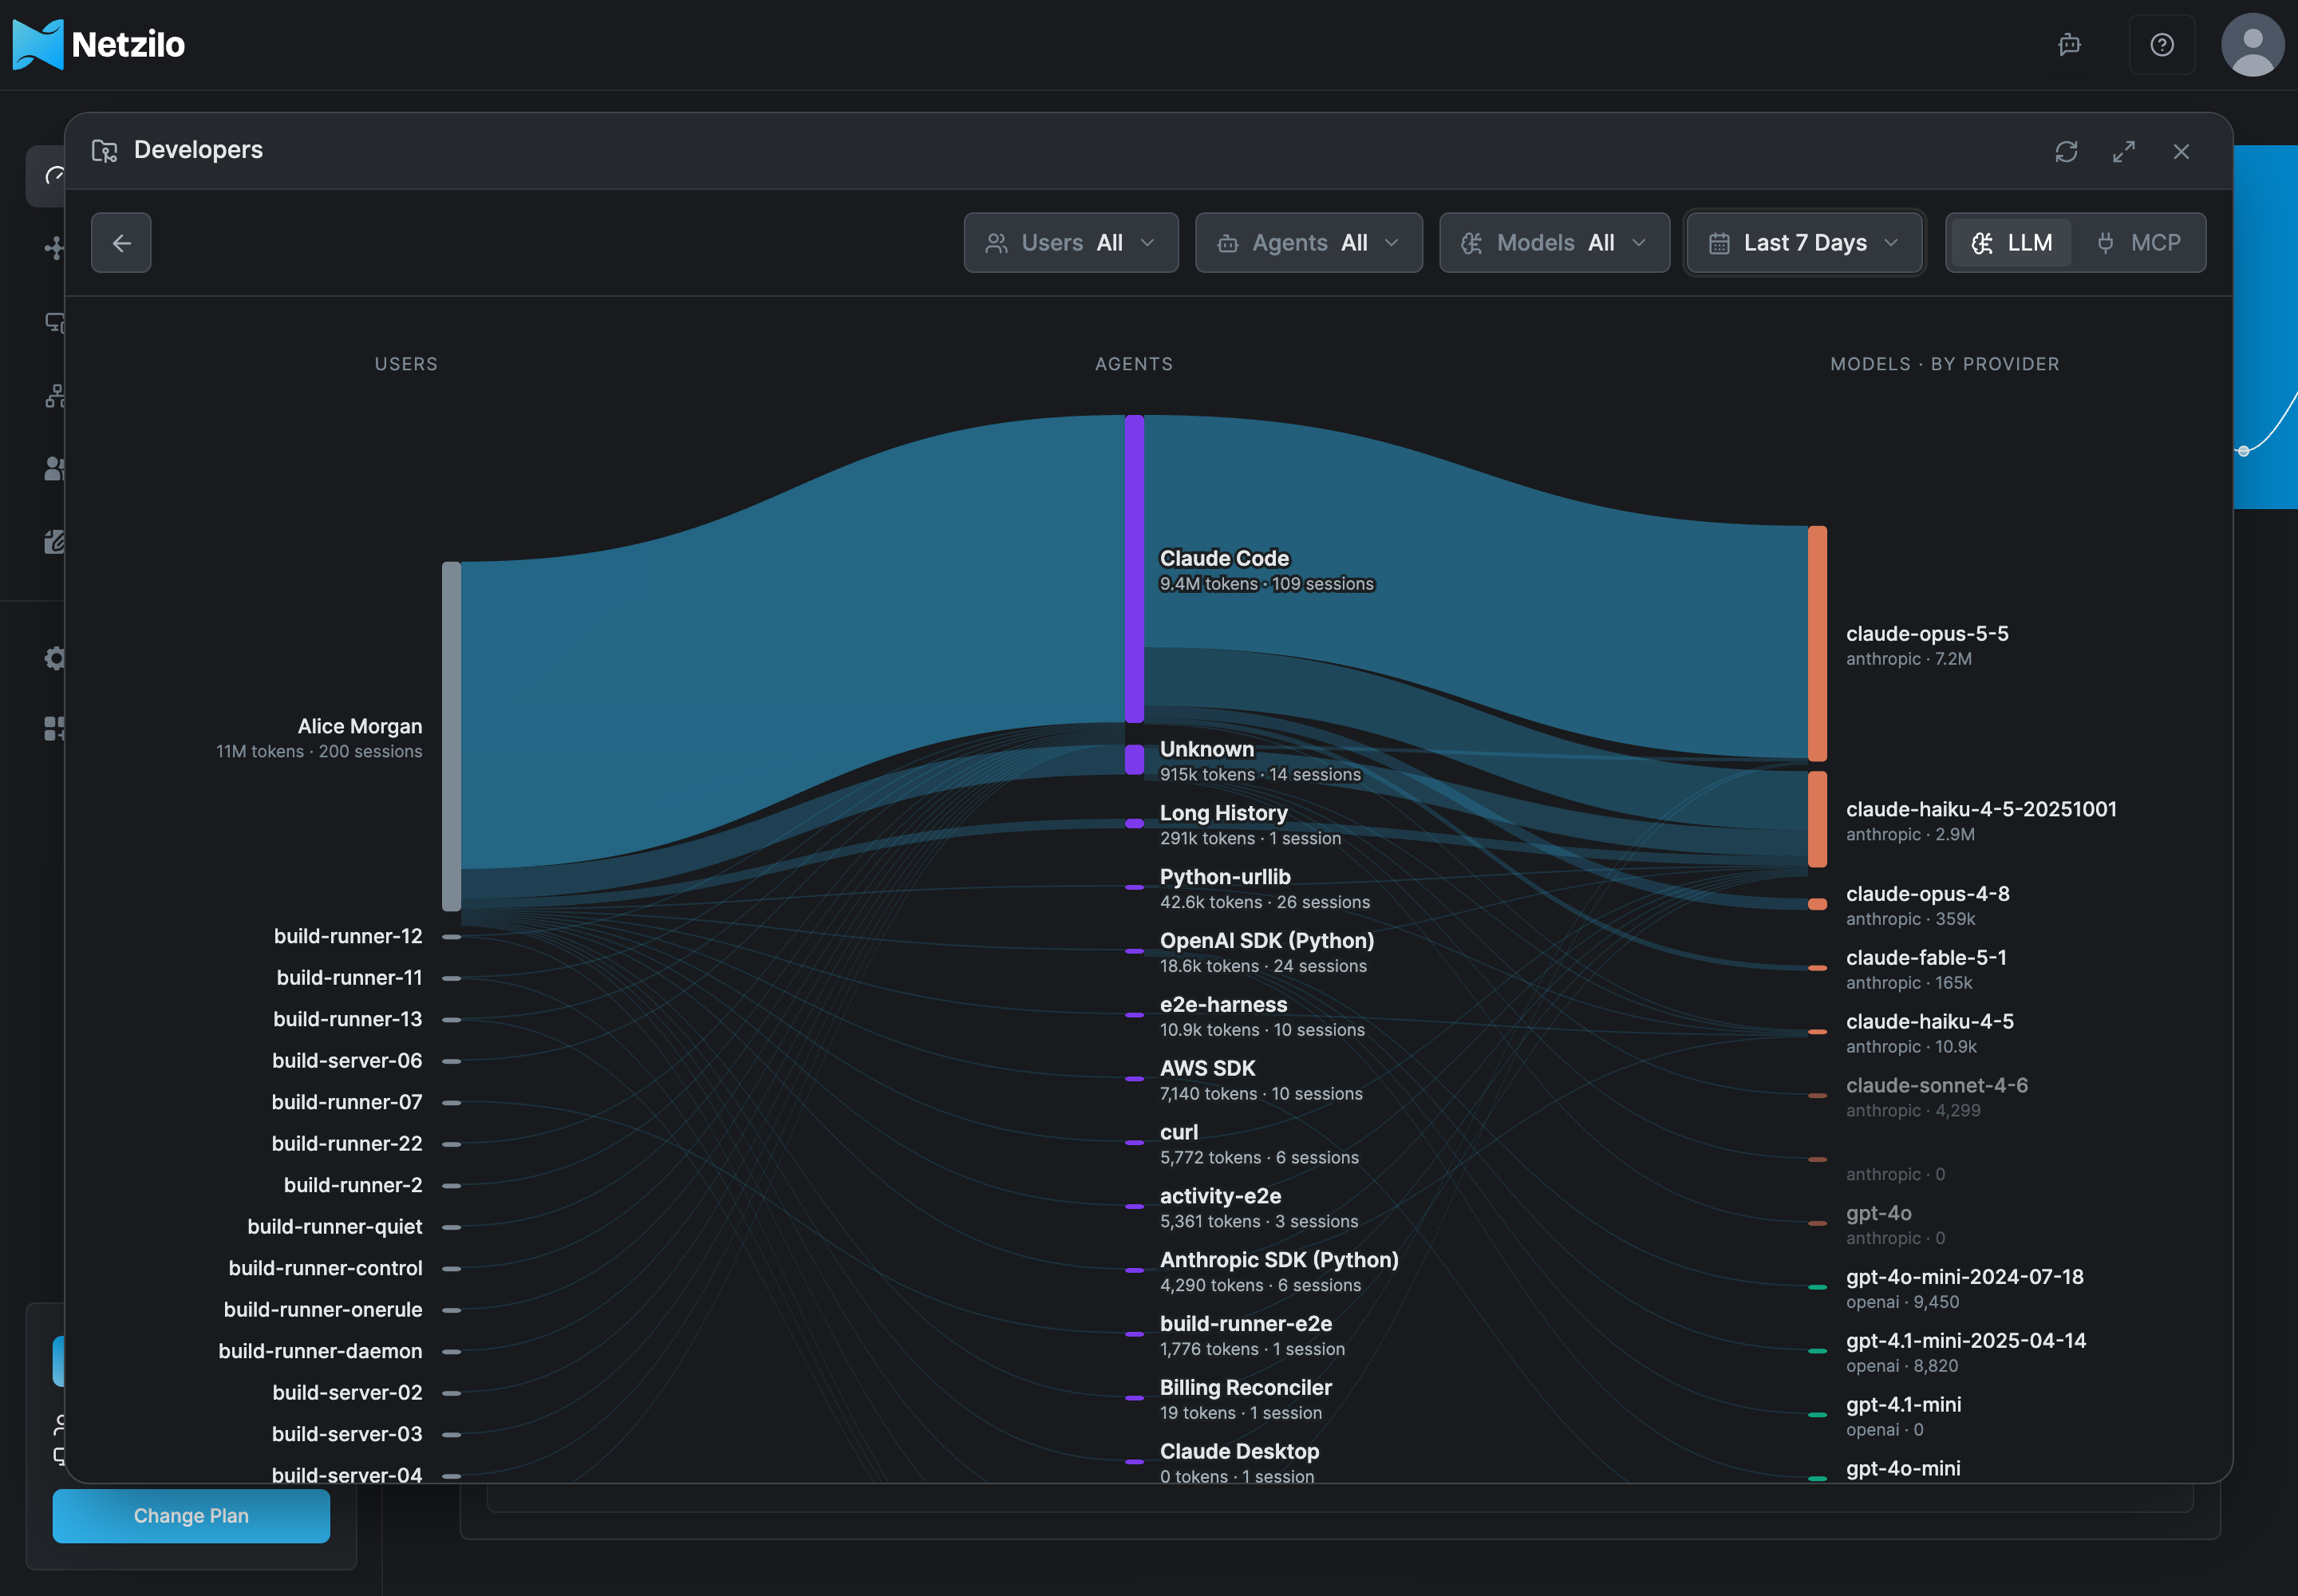
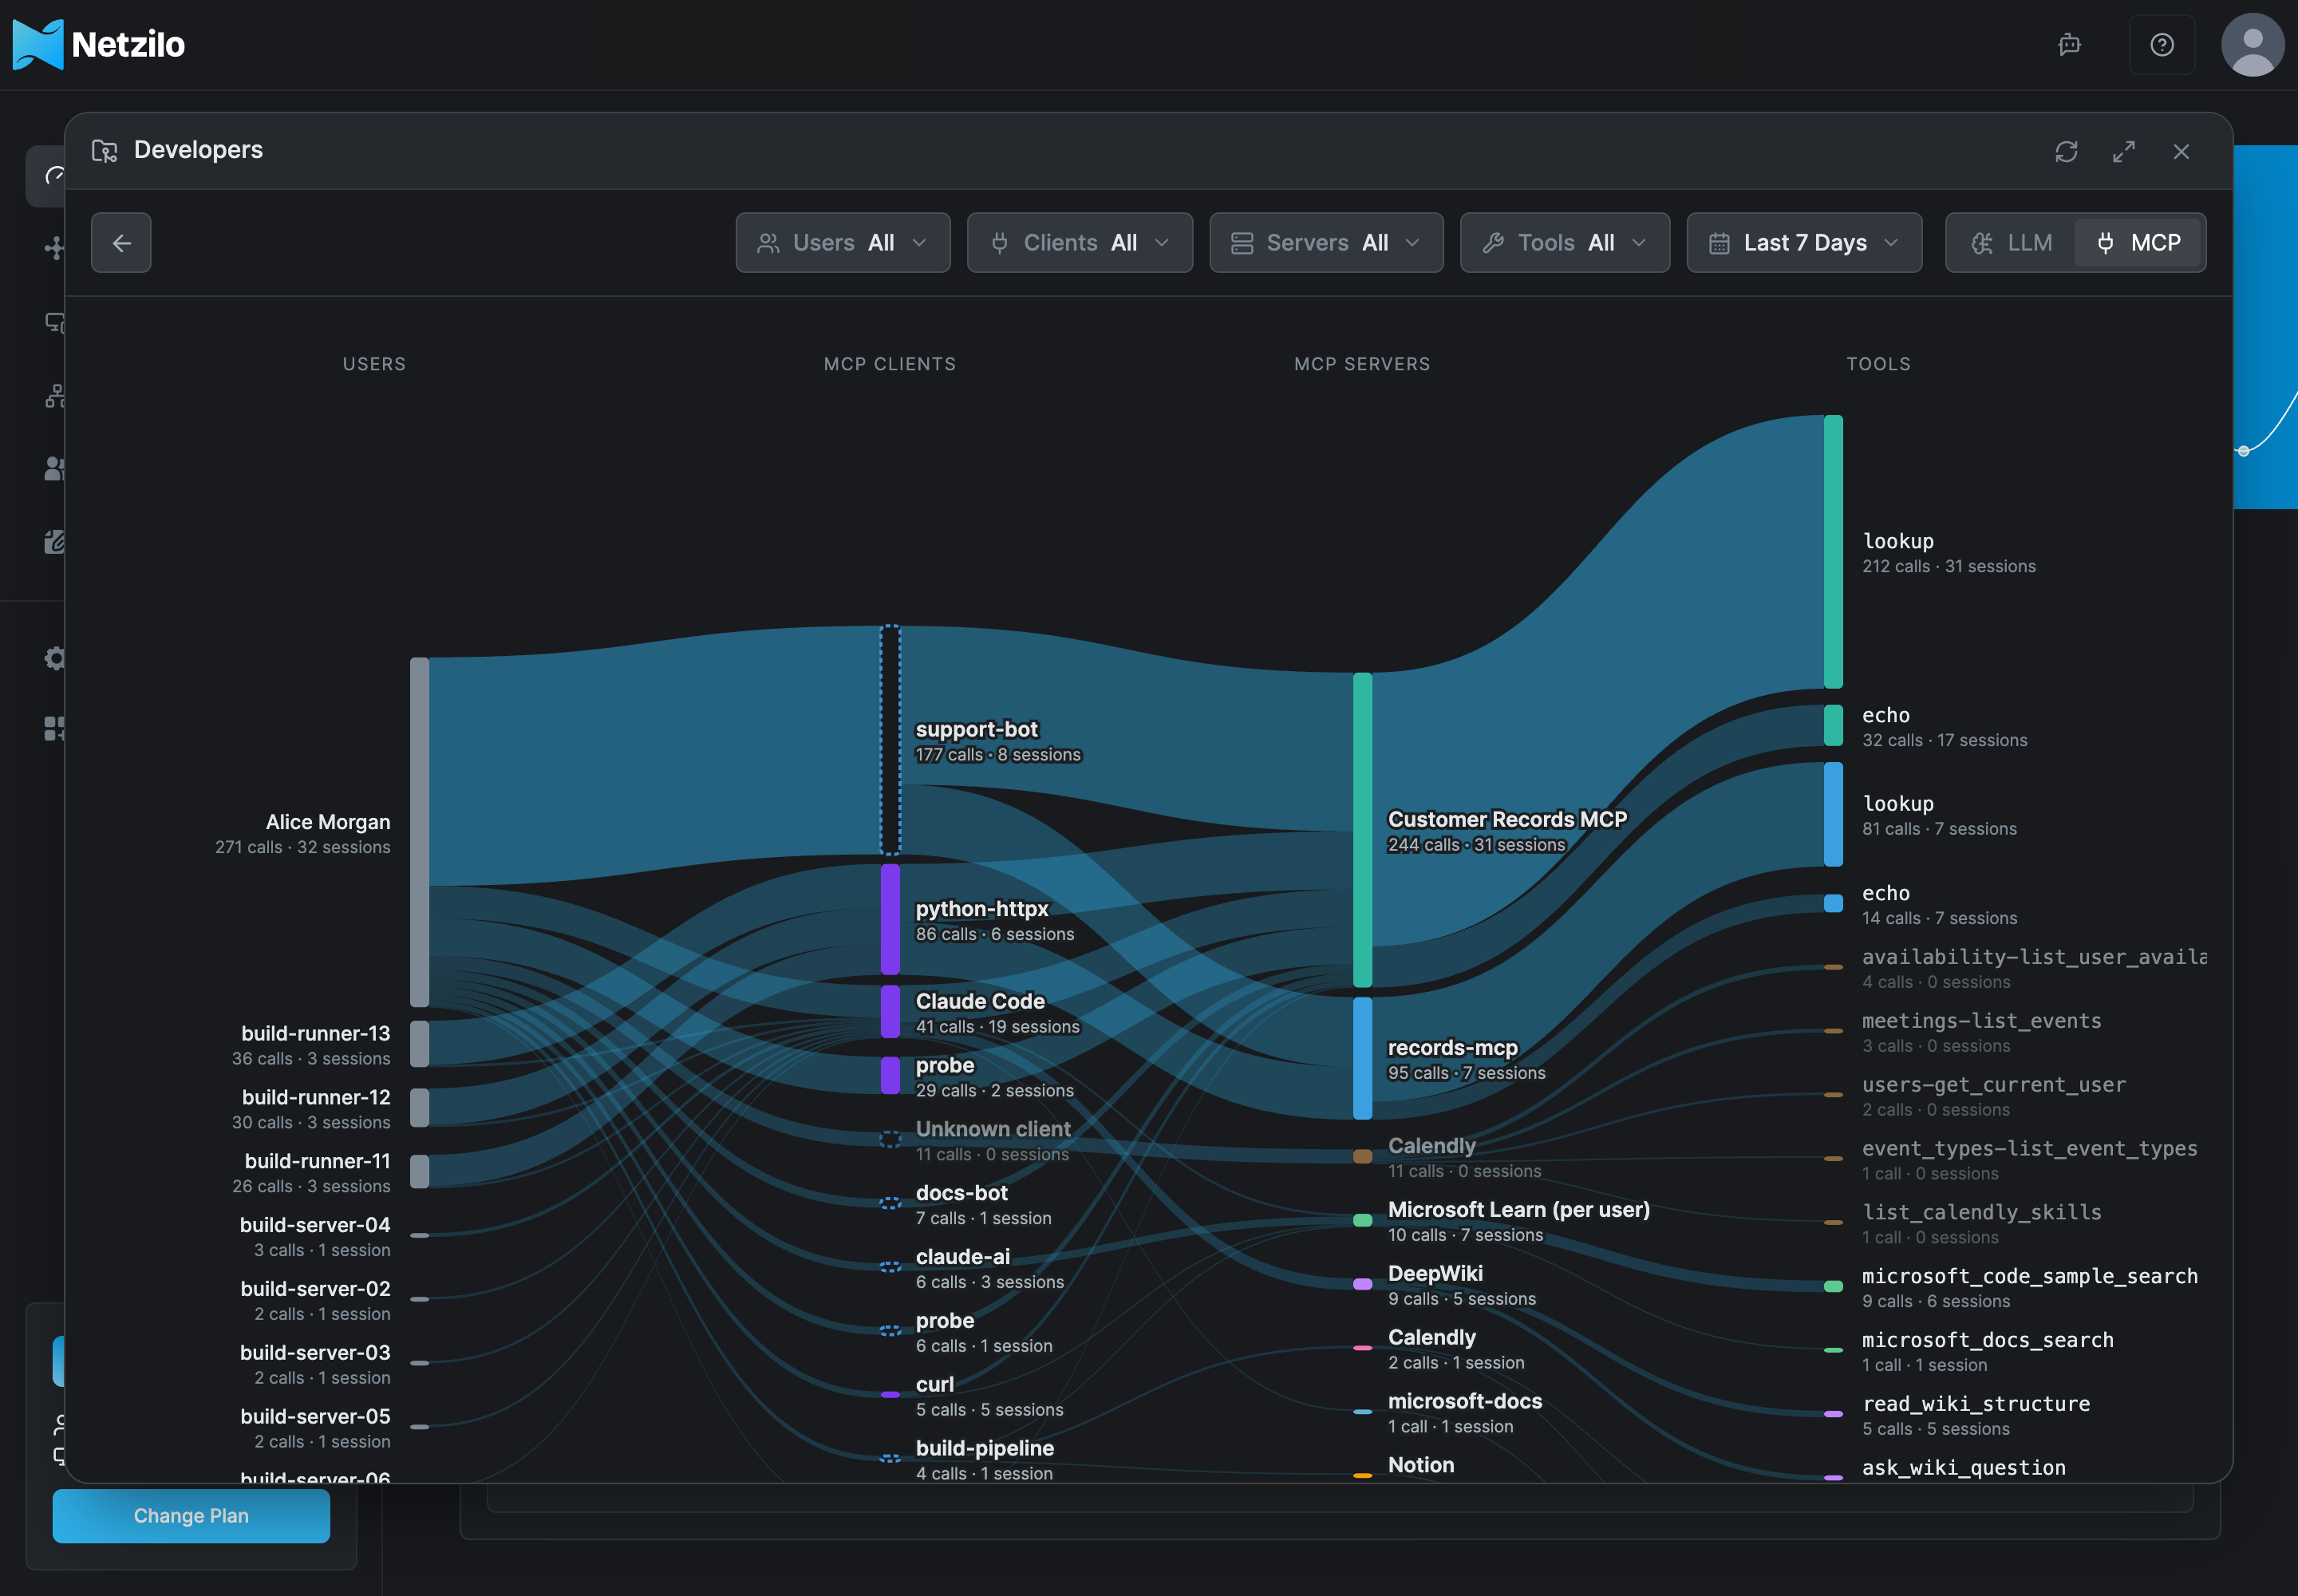
A team with many people shows its 40 busiest at first. The others are one node at the bottom of the Users column, N more people. Scroll to the end of the flow, or click that node, to add the next 40, up to 500 people.
Users, Agents and Models narrow the LLM flow; Users, Clients, Servers and Tools (grouped by server) narrow the MCP flow. The period menu changes the period. Click a name to list its sessions.
Sessions
A session is one run of an agent: a Claude Code conversation, an SDK agent's task, the calls a client made without a session of its own. The list shows, most recently active first, when each session started and was last active, its agent and user, its status, the models it used, its turns with its model and tool calls, its tokens and cost, and its violations. A session with a kill chain carries a kill-chain badge that opens it on the behavior graph. Search finds sessions by name, agent or model.
Opened from the MCP flow, the list shows when each session started and was last active, its user and agent, its MCP servers, its calls and distinct tools, the average latency of a call, its violations, and Model + MCP when the session also called a model or MCP only when it did not.
The list is read a page at a time. The arrows at the bottom move between pages and show the page you are on, for example 1 of 456. Started, Last Activity, Turns, Usage and Violations (and Calls on the MCP list) sort every session of the list, not only the page shown.
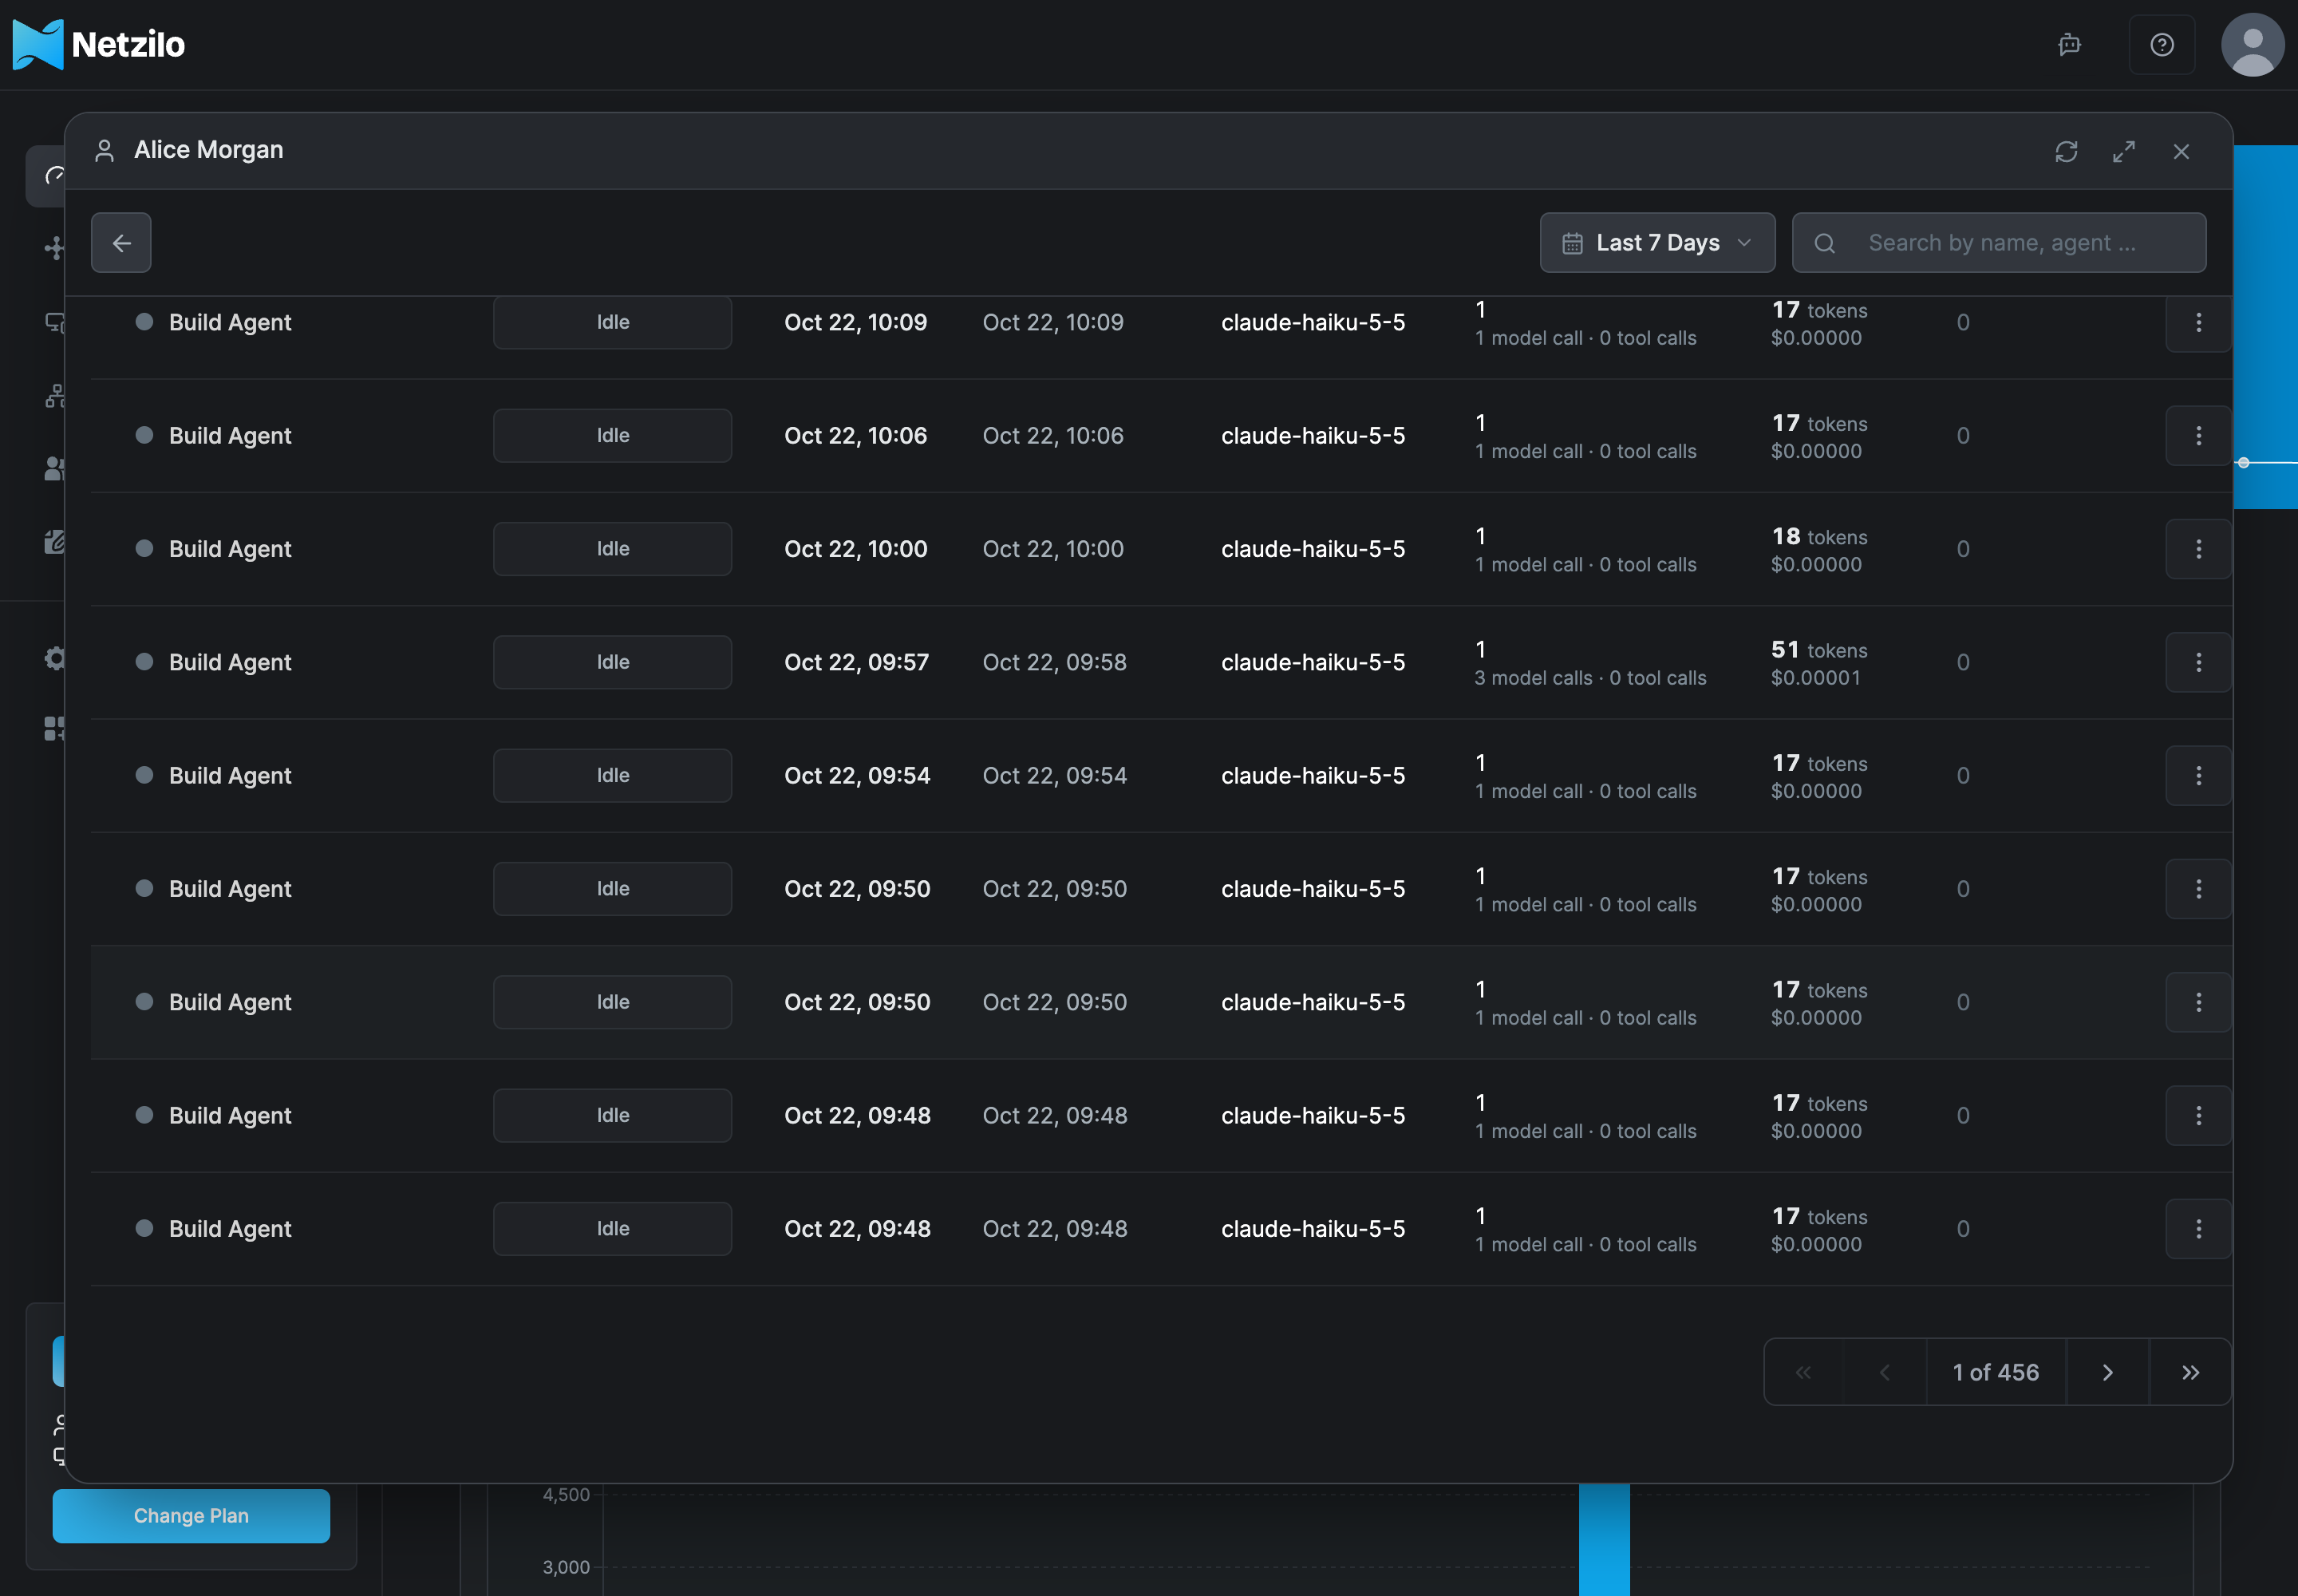
Click a session to open it.
Sessions tab
Sessions shows the sessions of the period as a honeycomb: one hexagon per session, grouped in a comb per team. A hexagon's color is its session's state, and nothing else:
| Color | State |
|---|---|
| Red | Under Isolation: a response action isolated the session |
| Orange | Under Inspection: a response action placed the session under inspection |
| Green | Active: the session is running |
| Blue | Idle: the session is idle or finished. The more tokens it used, the brighter the blue: under 1K, 1K to 10K, 10K to 100K, 100K to 1M, and over 1M tokens |
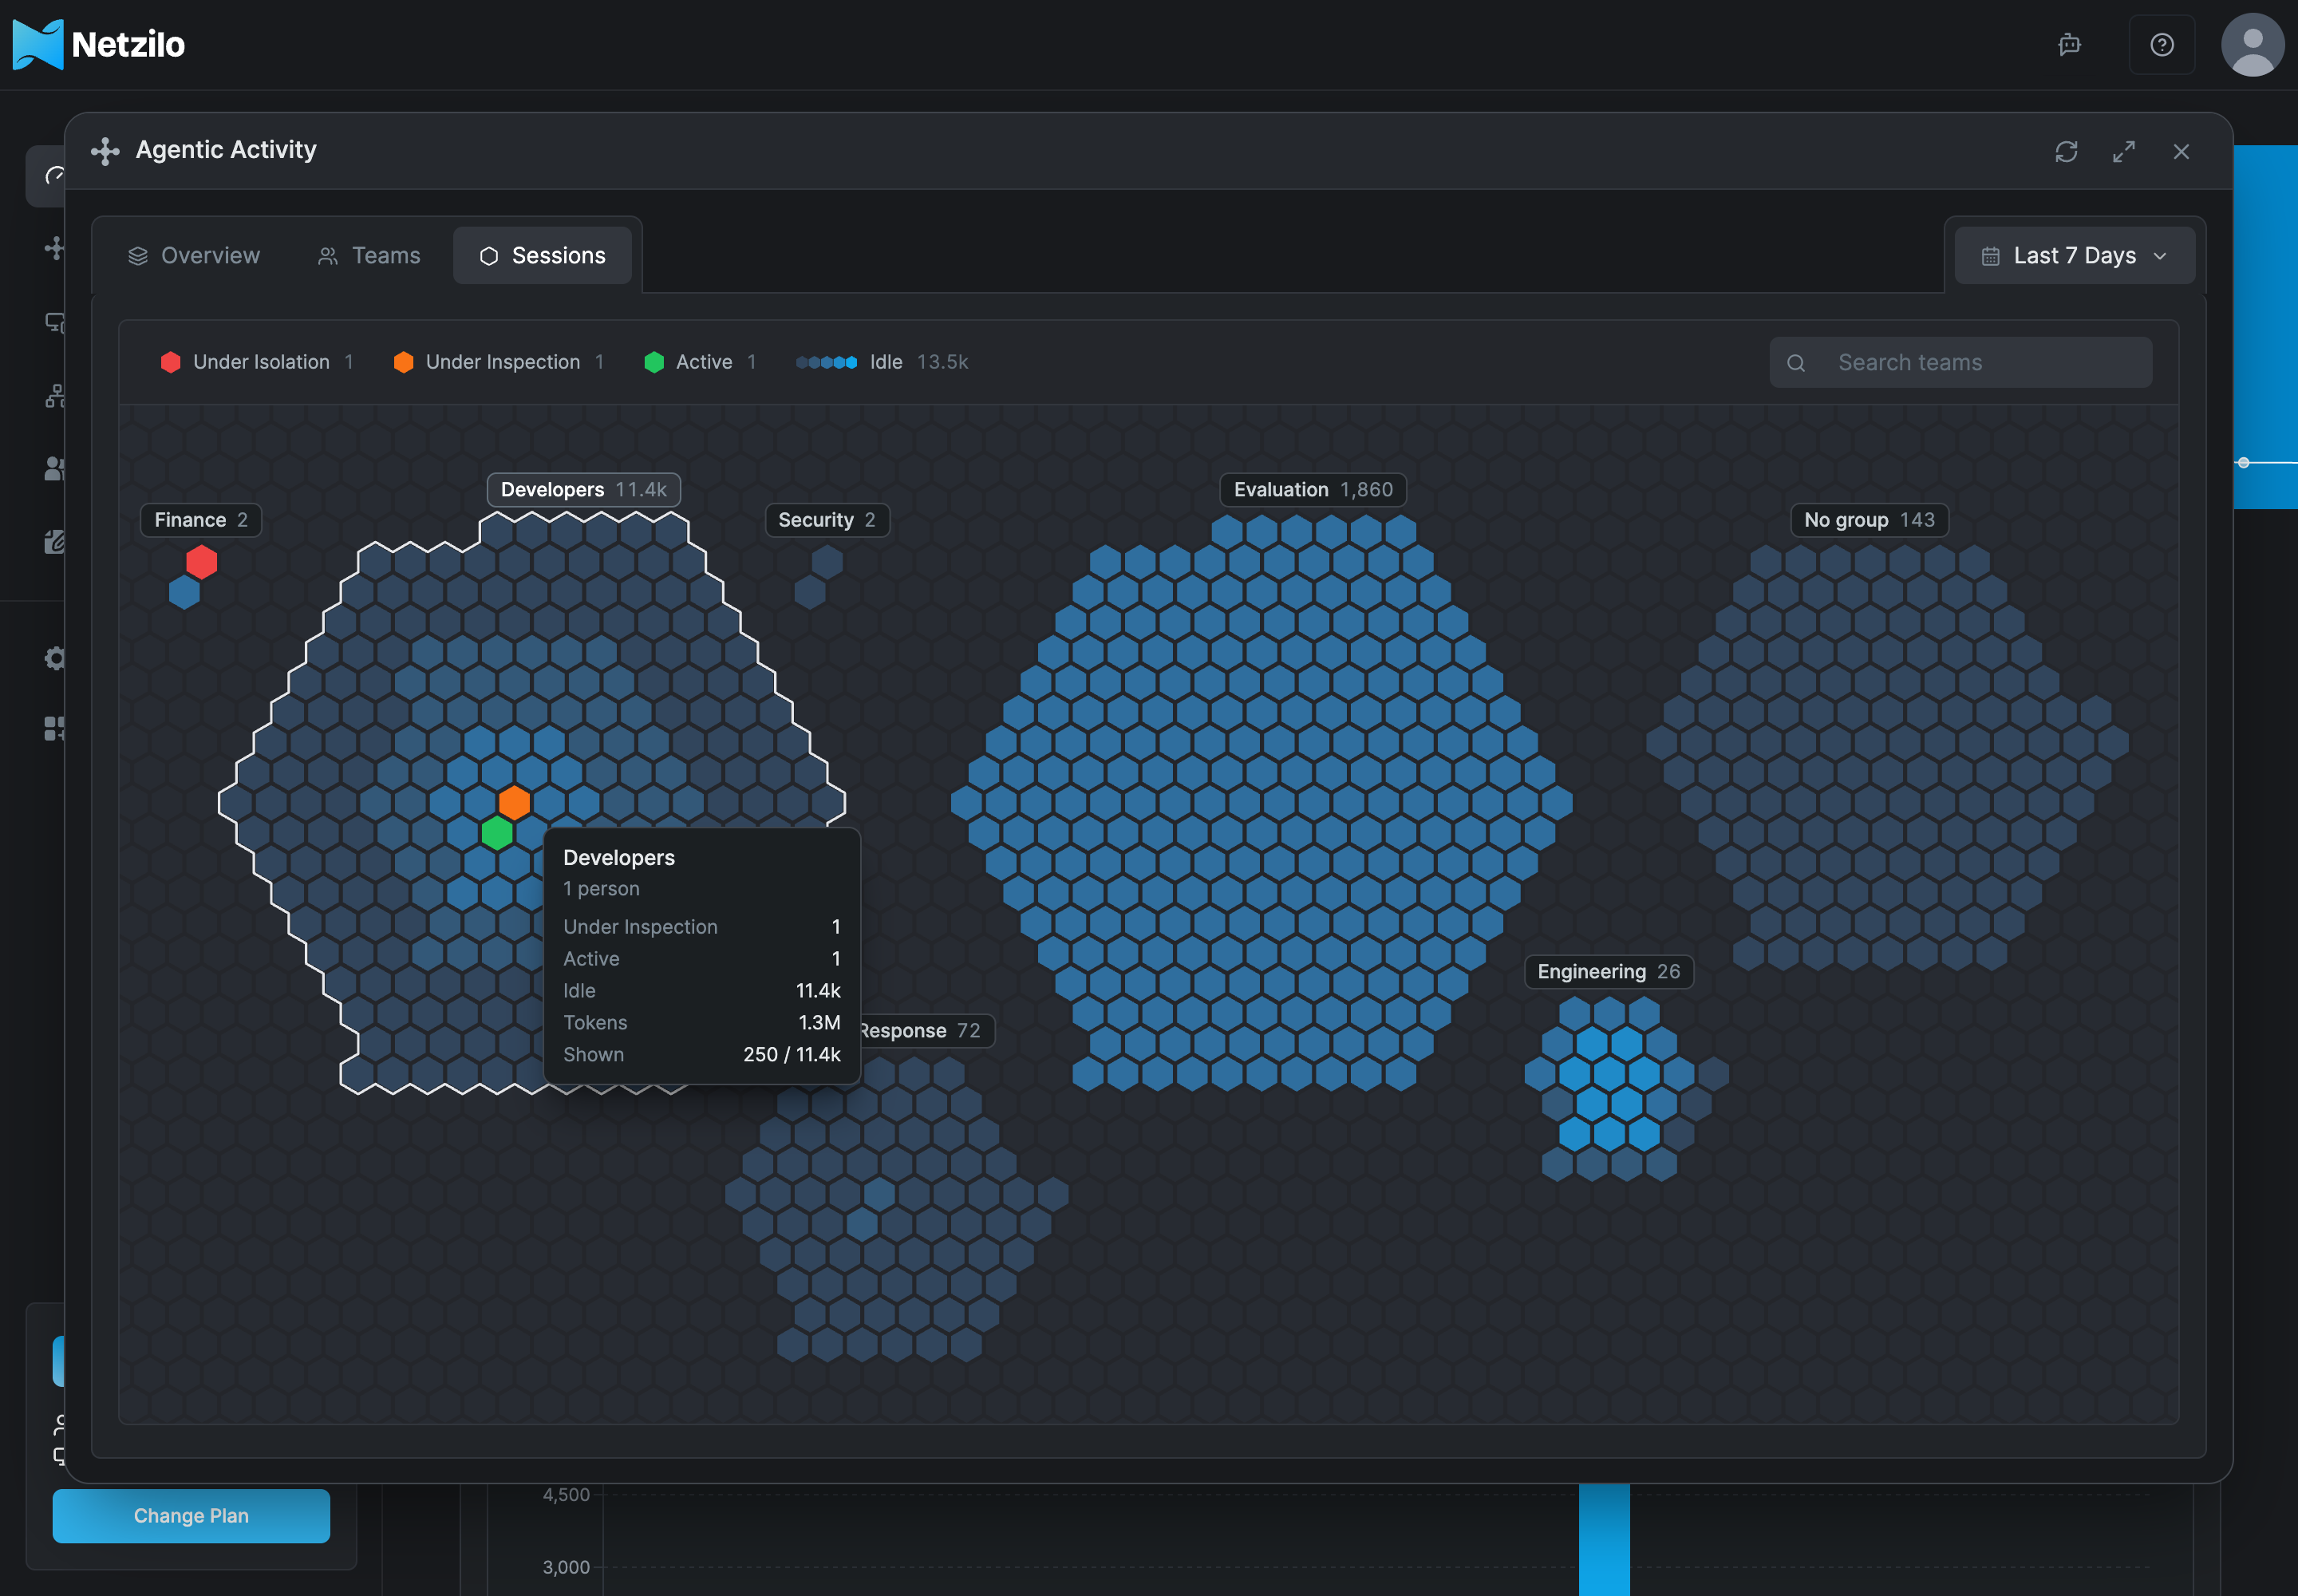
- A comb fills from its middle out: the isolated sessions first, then those under inspection, then the active ones, then the idle ones, those with the most tokens first.
- A comb shows at most 250 hexagons, fewer when there are many combs. The number next to its name is always the exact count of its sessions; hover over a comb for its counts by state, its tokens, and how many of its sessions are shown.
- The legend at the top counts the sessions of the page's level by state: every team's, or every one of the team's or the person's, whether its comb is shown or not. Click a state to show only its sessions; click more states to add them, and click again to remove one.
- A person is in one team: the most specific group (the one with the fewest people) of the groups their latest session in the period recorded. People in no group but All are in No group.
- With many combs, a name shows over each comb that is wide enough for it, or that holds isolated or inspected sessions; hover over a comb to see the others.
- With more than 100 combs, or more than fit, the combs keep a small size and the page scrolls; more combs load as you scroll down. Search teams finds teams by name among all of them.
Click a team's comb, or its name, to open its people: a comb per person, with the legend and Search people at the top of the window.
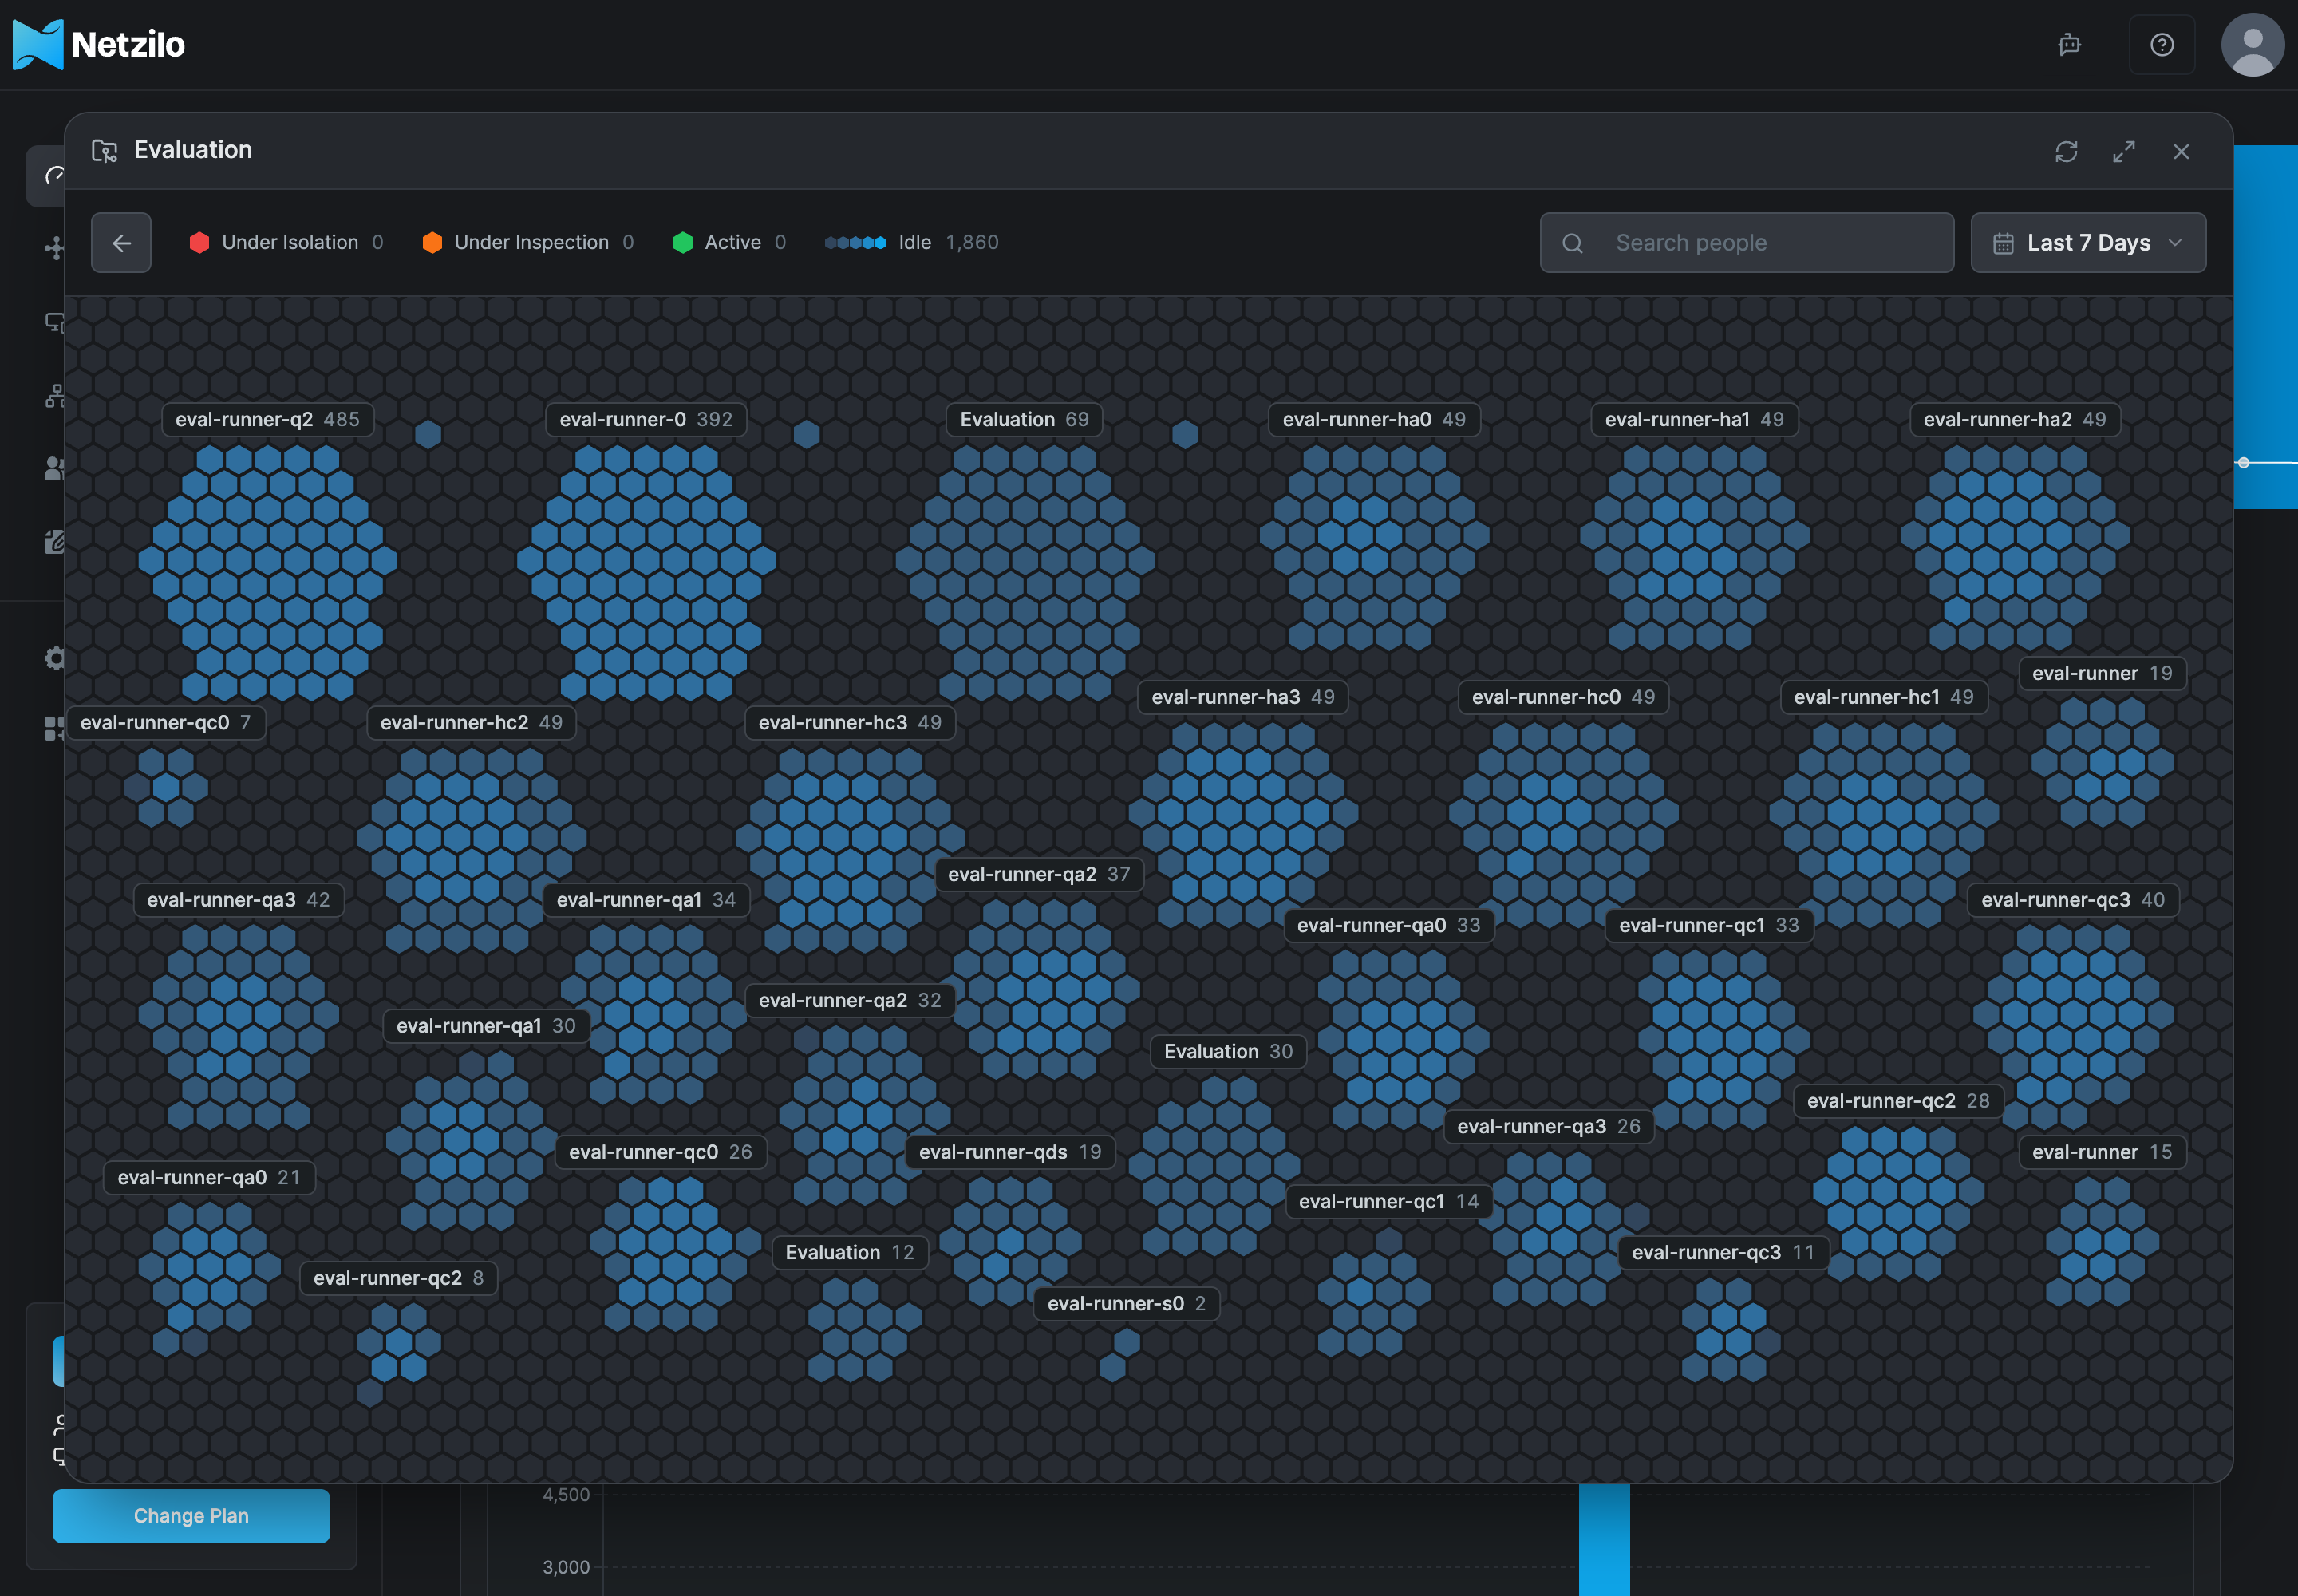
Click a person's comb to open their agents: a comb per agent, each hexagon one of the agent's sessions. Hover over a hexagon for the session's state, the reason a response action gave, its model, tokens and start time. Search agents narrows the combs.
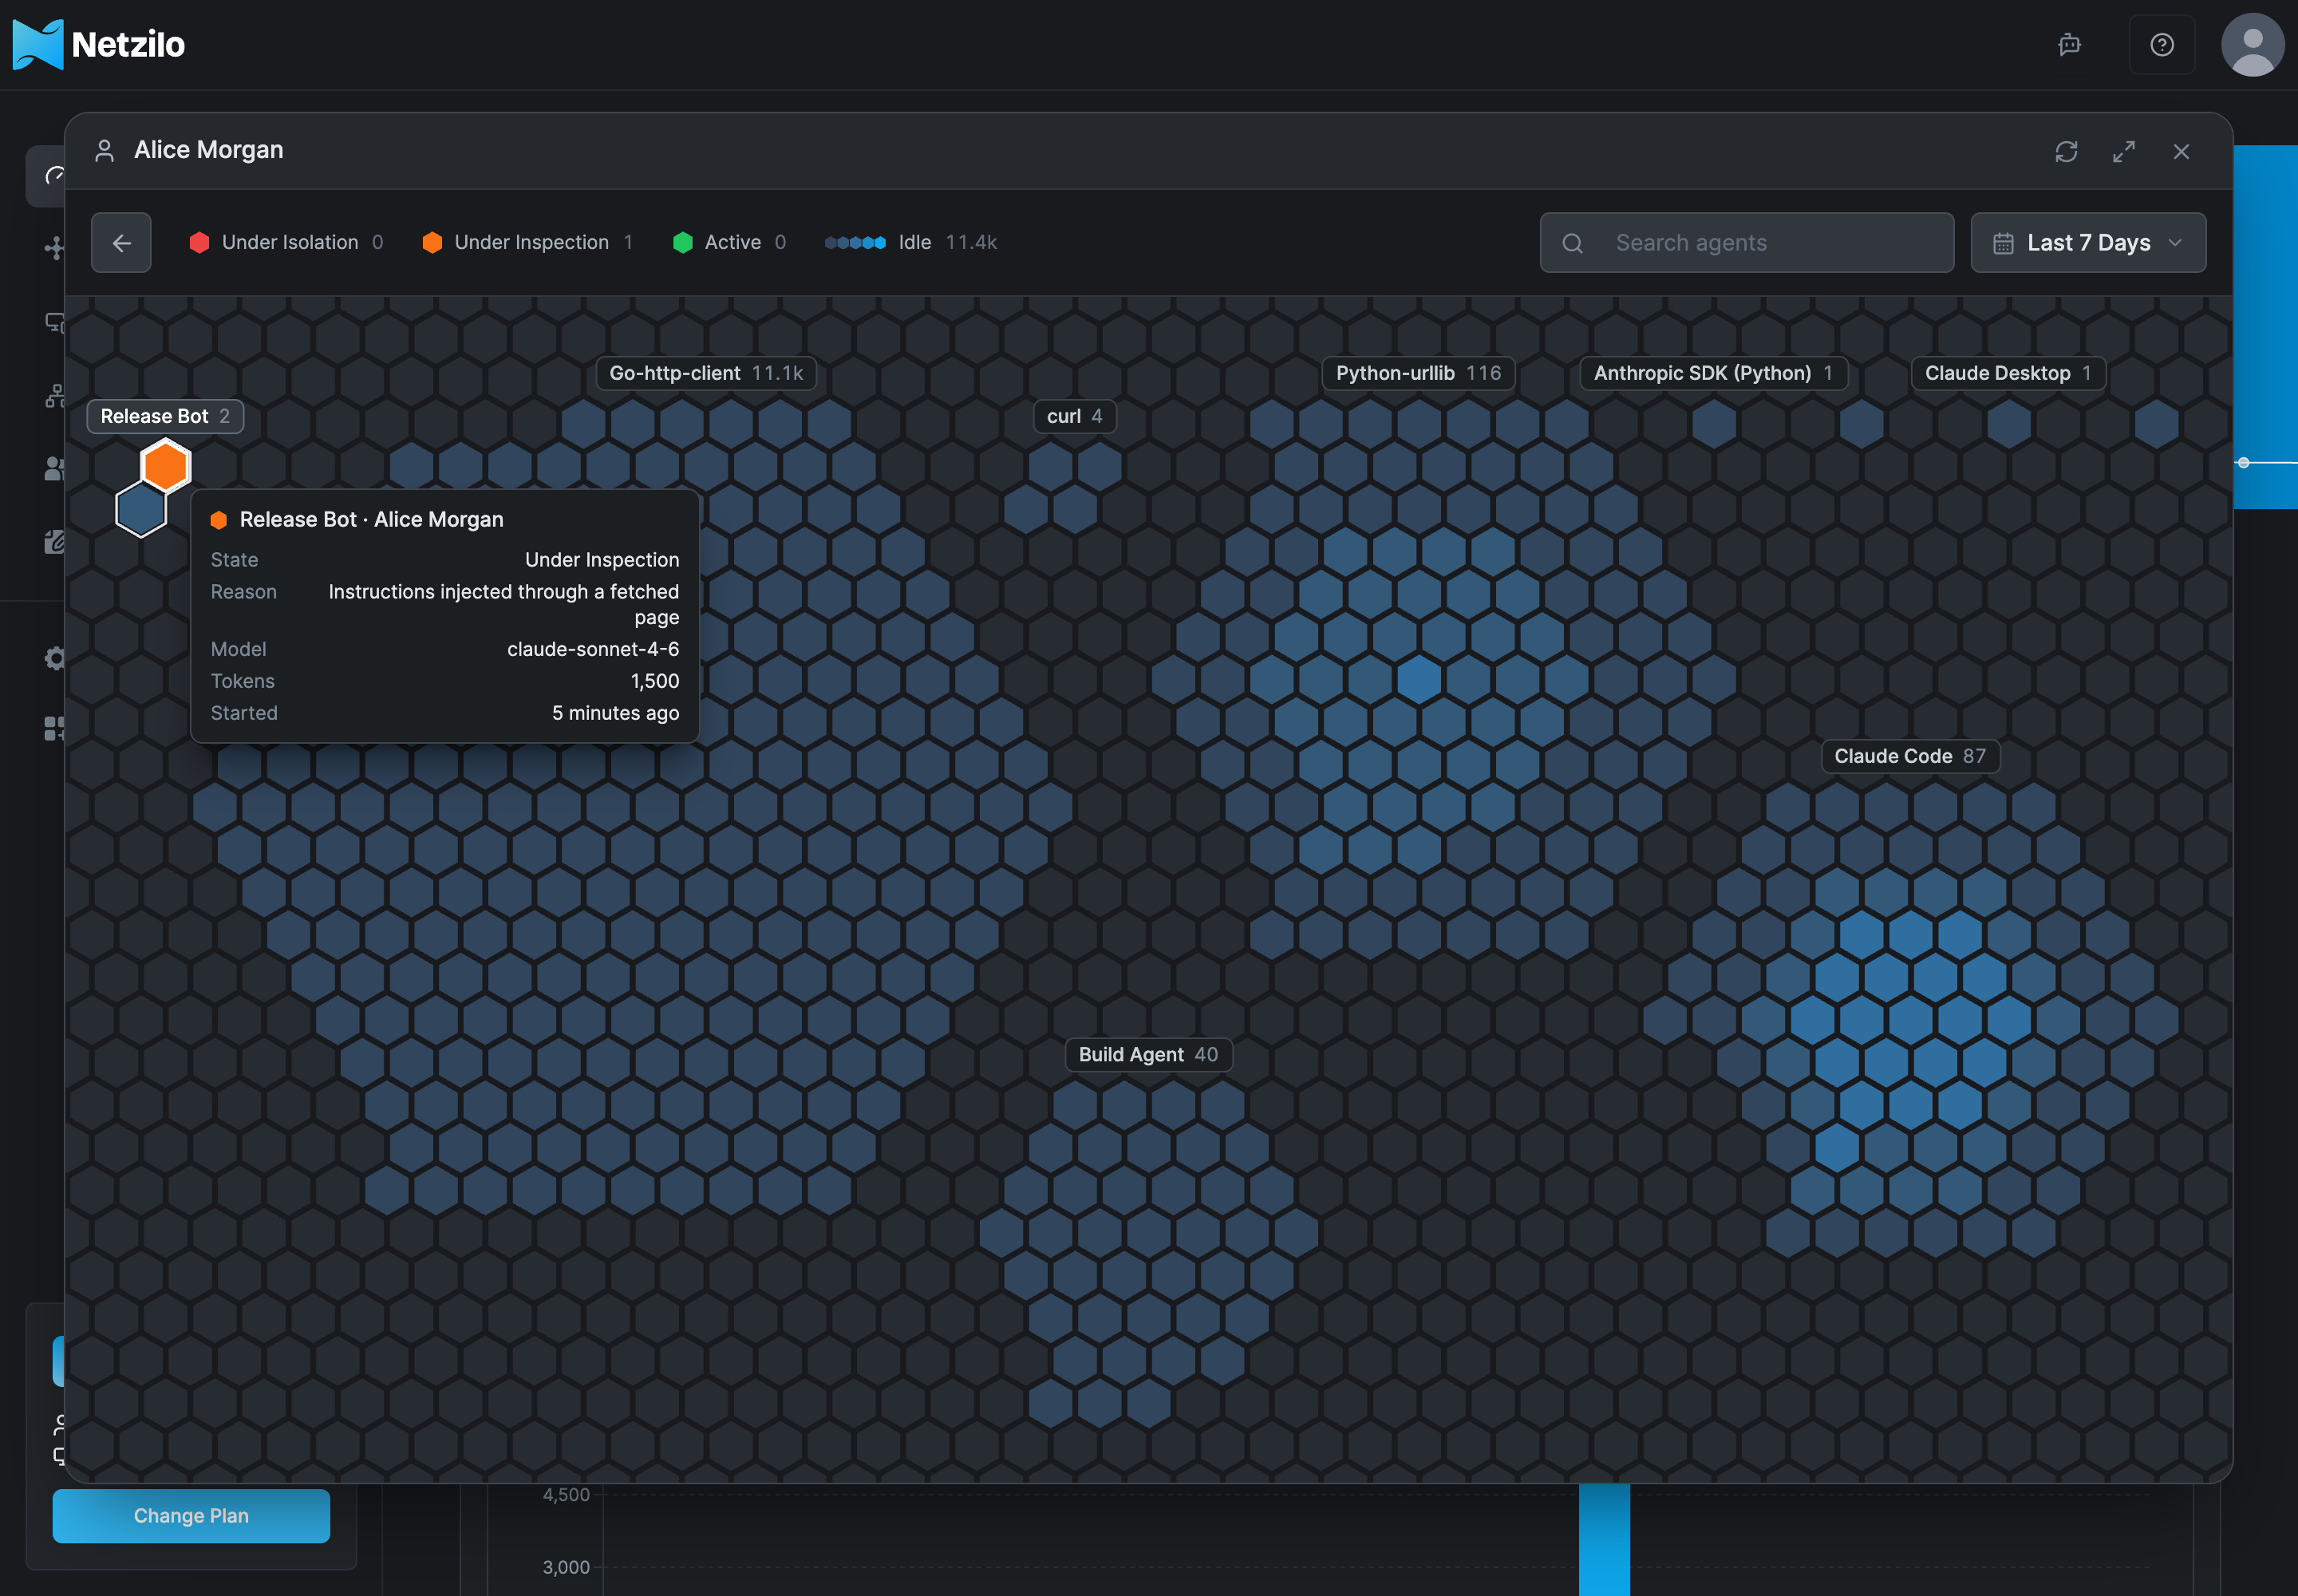
Click a hexagon to open its session. The arrow at the top left, or Escape, goes back one level: from the session to the person, to the team, to the tabs.
A session
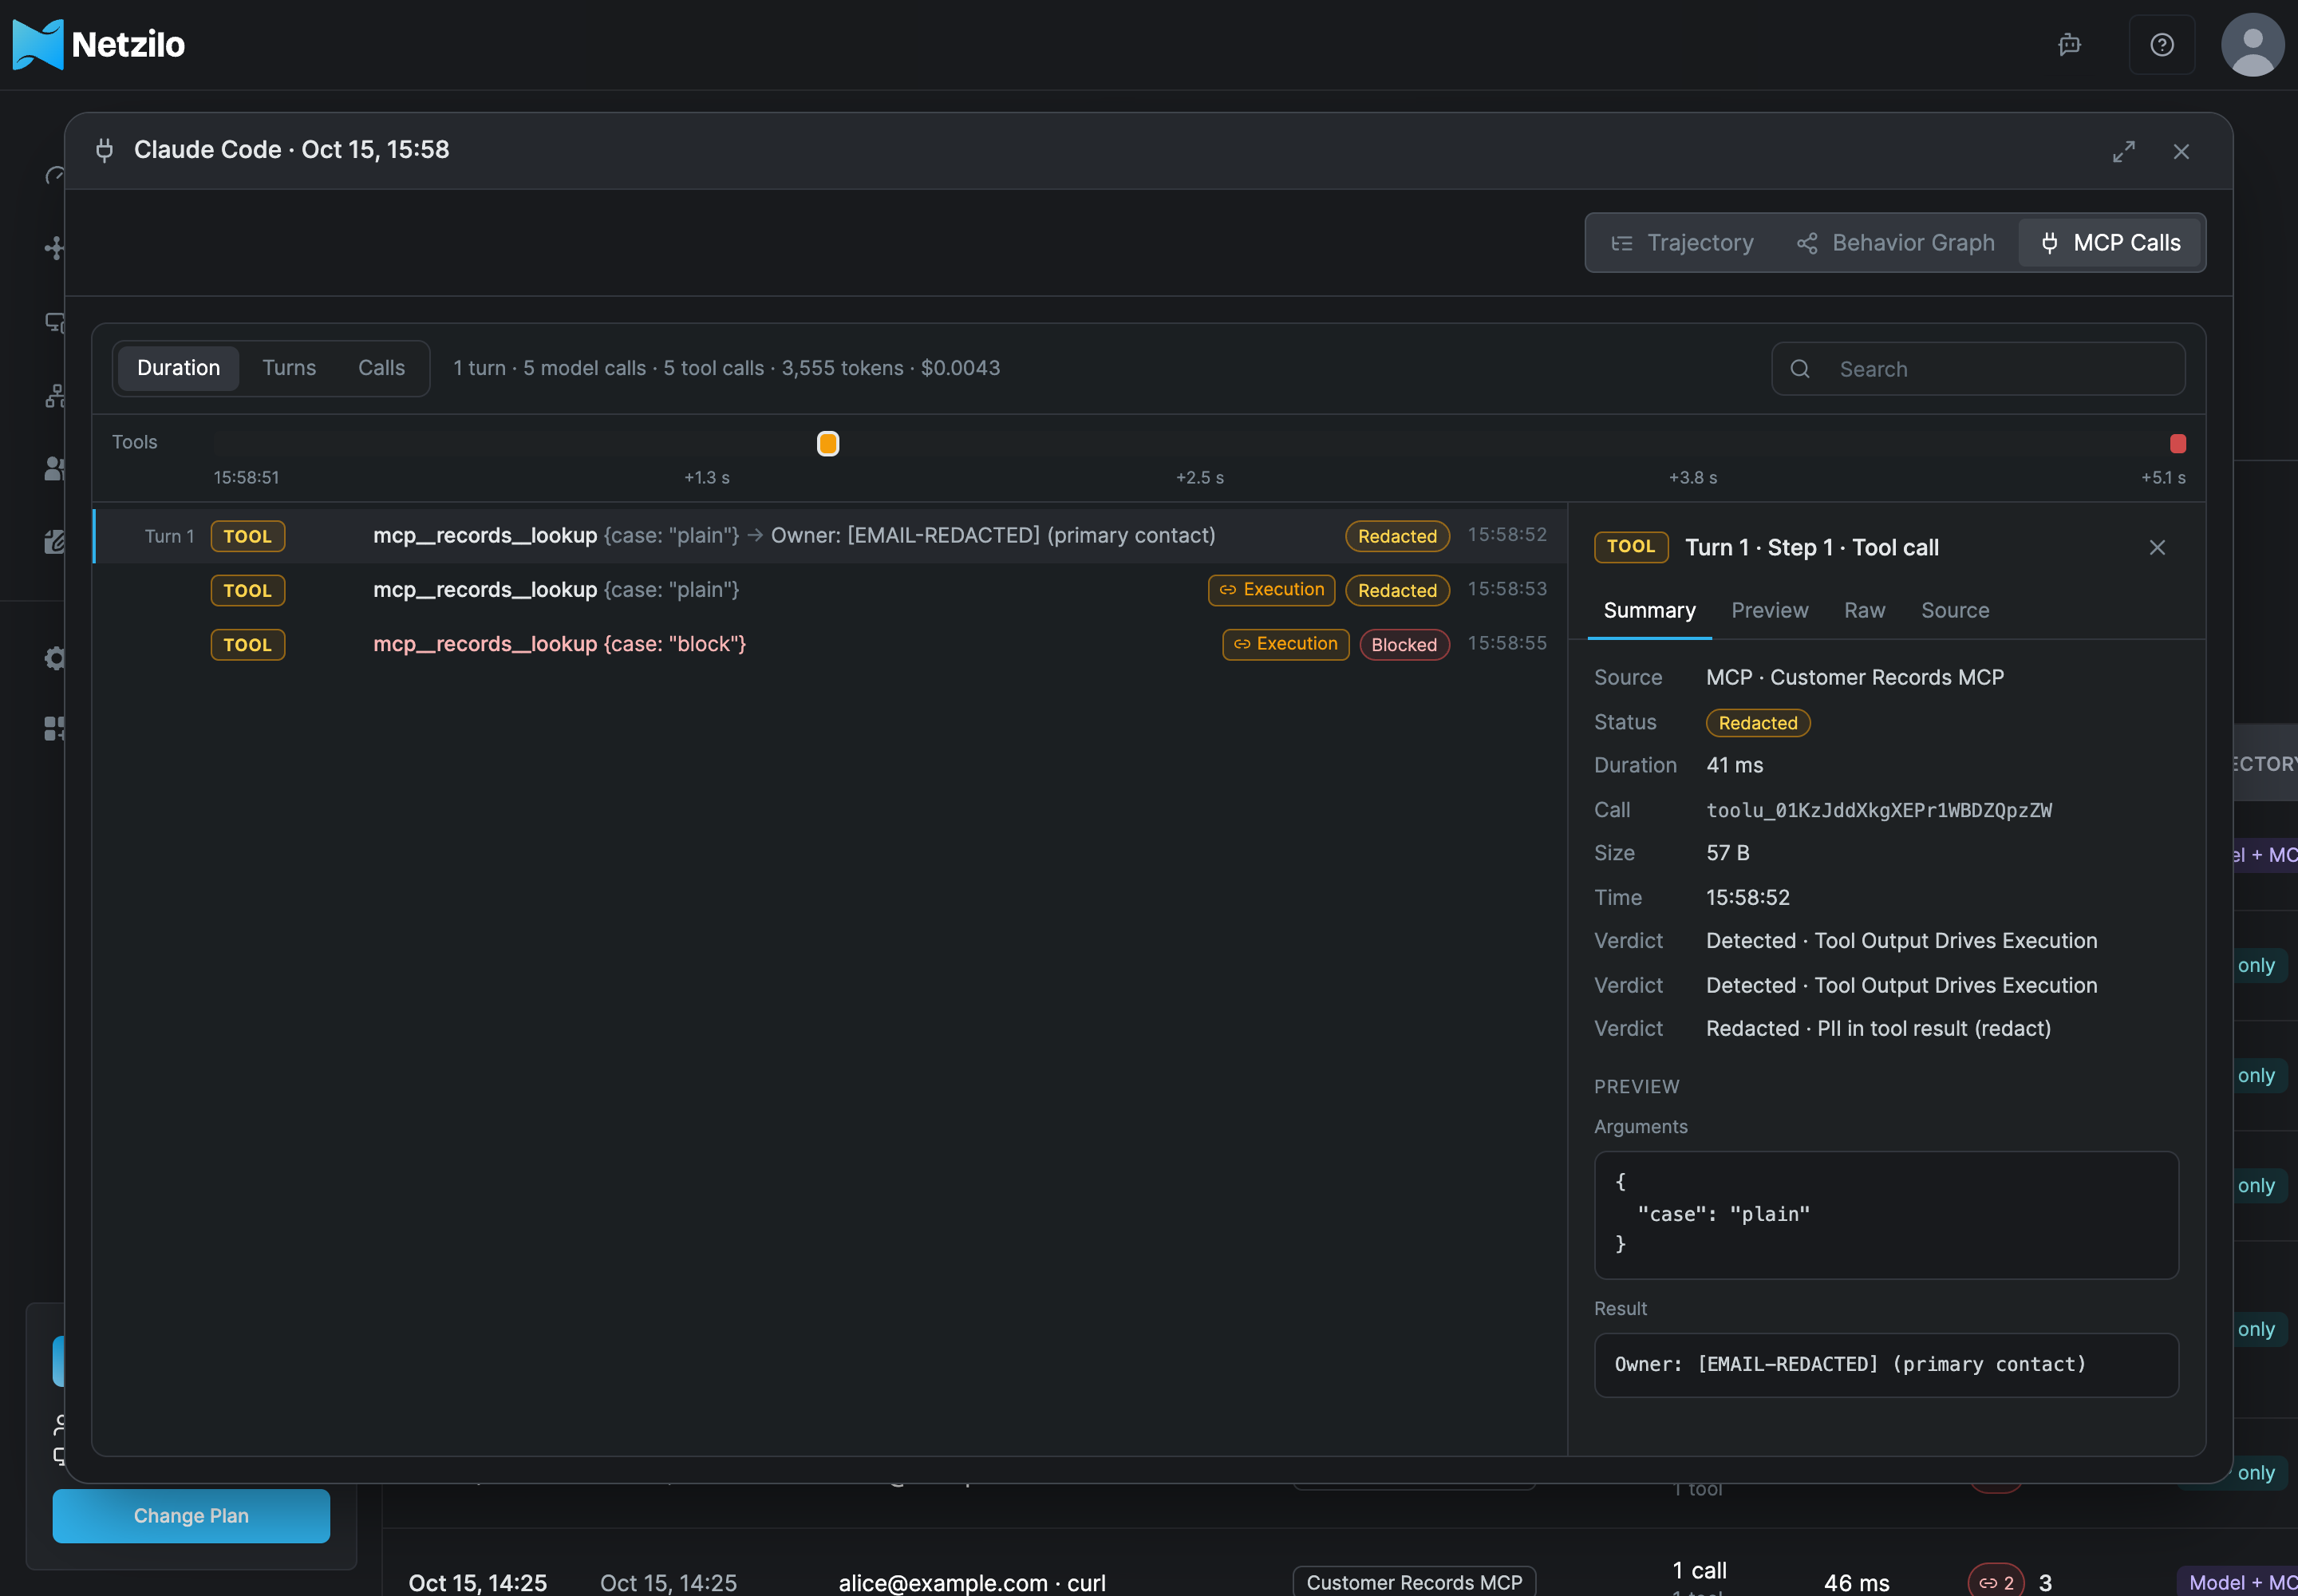
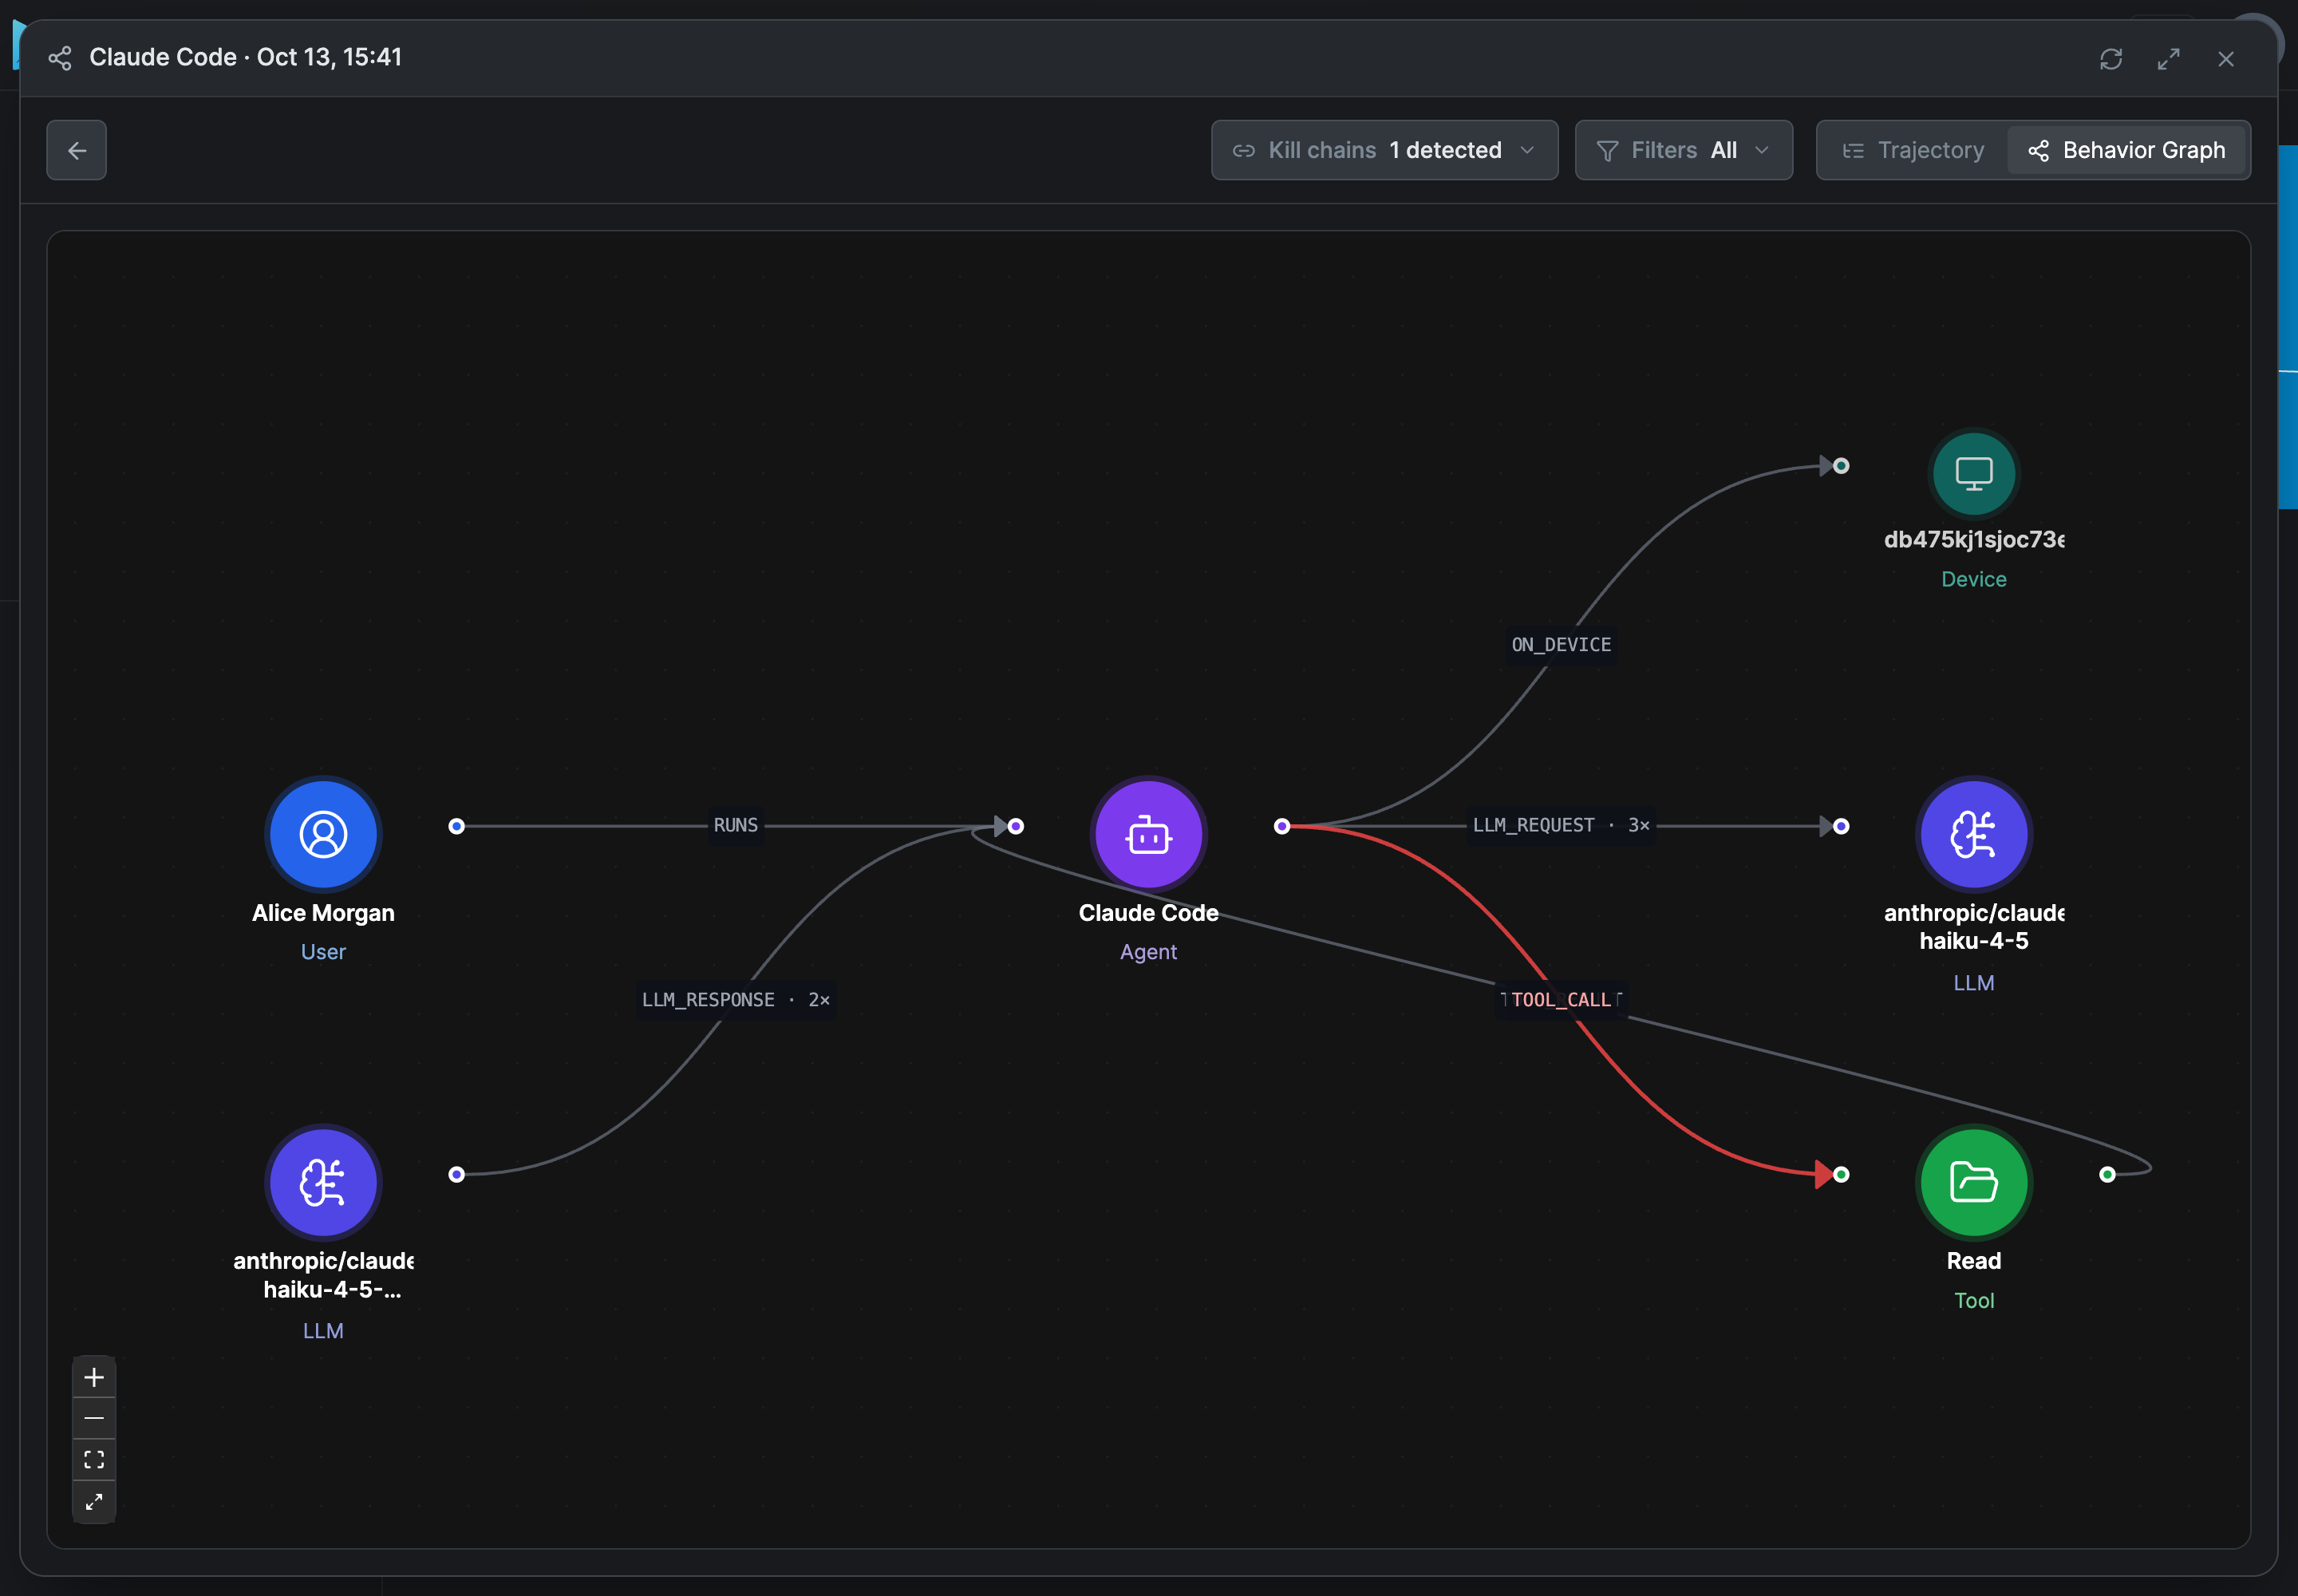
A session opens on its Trajectory. The tabs at the top right are Trajectory, Behavior Graph, which shows the same session as a graph, and, when the session made MCP calls, MCP Calls.
The Trajectory shows the session step by step:
- A timeline with the lanes Input, Model, Tools, Host when the device reported activity, and Kill chain when the session has one. Duration, Turns and Calls change its scale.
- Below it, every message in order, by turn: the system prompt, the user's prompts, the agent's context, the model's thinking and answers, and each tool call with its result. Guardrail verdicts and kill-chain steps are marked on the messages they fell on.
- Long texts show their beginning; click a message for the whole text and its details. For a tool call, the Source tab names the server, the tool, who ran it, the MCP client, the MCP session and Seen at, the gateway or device that recorded it. For a model call, the Source tab shows the Request, the Model that answered, Asked for, the model the caller named, Routed by, the routing rule that sent the call elsewhere (A deleted routing rule once it is deleted), the Provider, the Step, Tokens, Cost, Duration and Started.
- On a device, the agent's Host activity is shown under the tool call that caused it: the processes it started, the files it read, wrote, created, deleted or renamed, and the connections and requests it made. Activity that no tool call explains follows the step it came after. The summary counts processes started, files read and written, and connections.
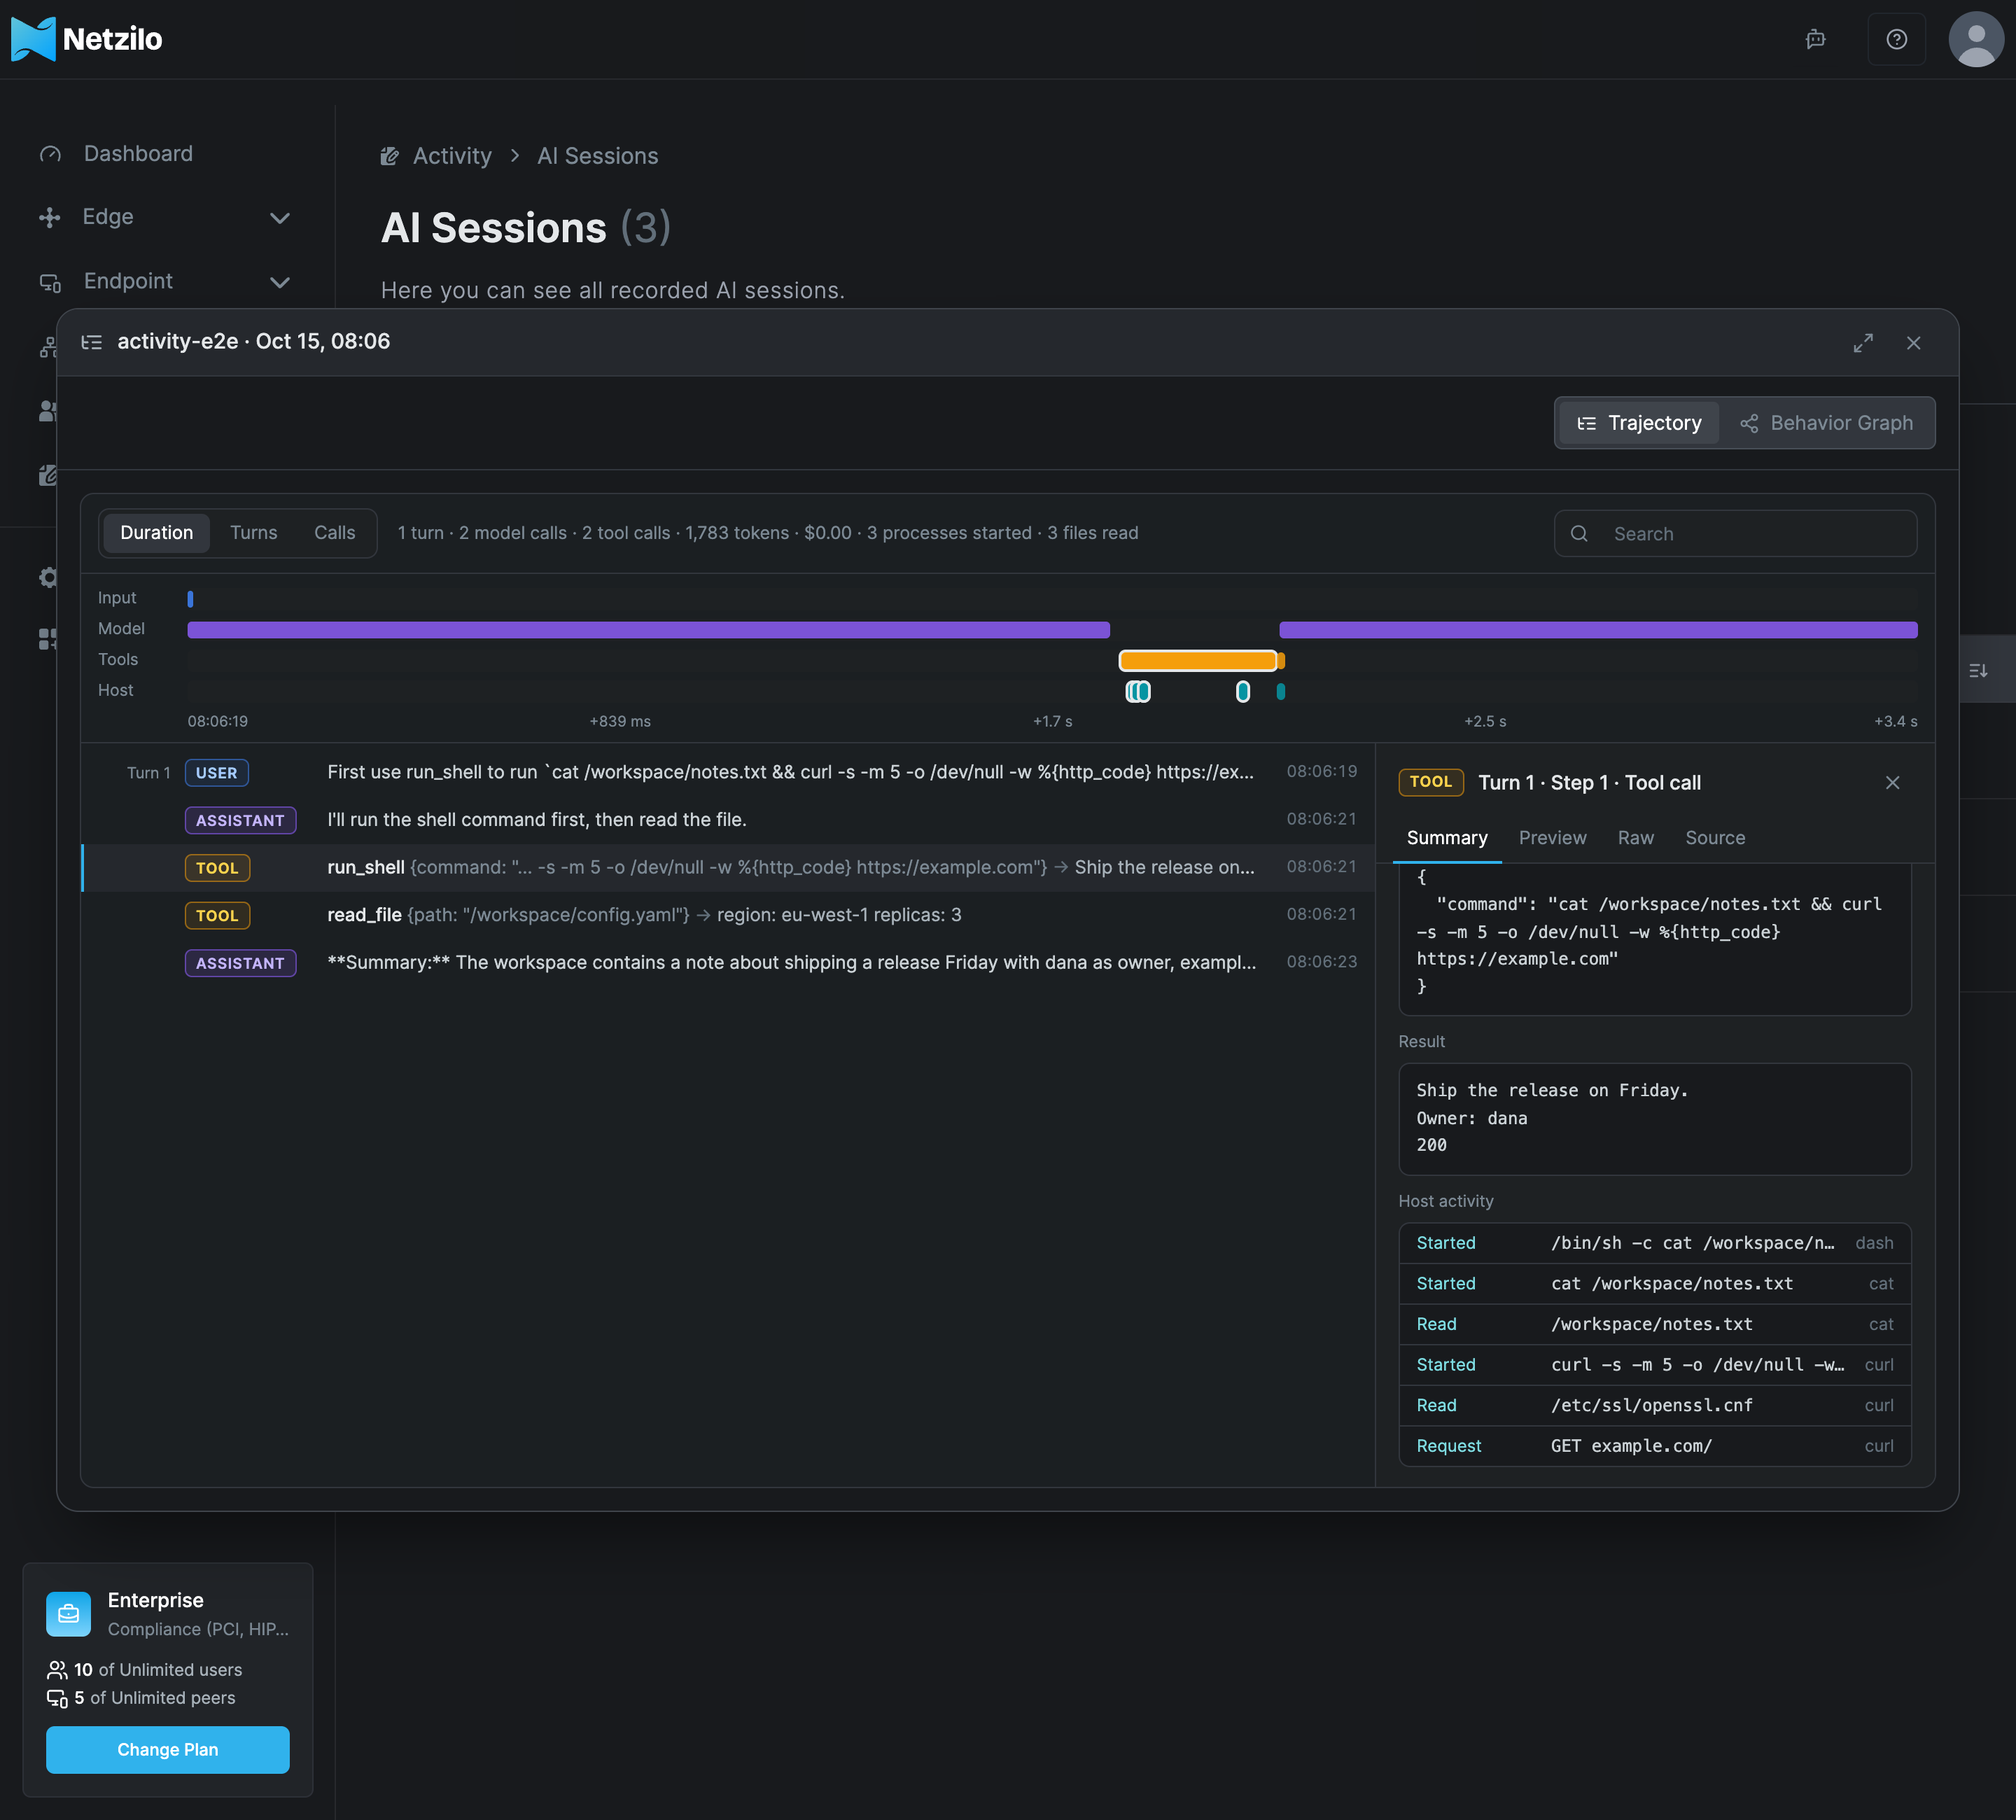
The messages are those the AI Gateway or the device's Netzilo client recorded: what the agent sent and received, after the guardrails. Text a guardrail redacted is shown redacted, and a tool call the guardrails held back is not kept. See AI Gateway.
The Behavior Graph shows who and what the session touched: the user, the agent, the models, the tools and the device, with the steps between them. File activity is one node per program. Kill chains picks a detected chain and marks its steps; Filters hides node and edge types.
MCP Calls lists the session's MCP tool calls: each call's tool, its arguments and the start of its result, its verdicts (Redacted, Blocked, a kill-chain stage such as Execution) and its time. Click a call for its details, arguments and result.
Devices
The Devices panel at the bottom shows two charts:
- OS Distribution: how many devices run Windows, OSX, Linux, iOS and Android.
- Security Score Distribution: how many devices fall into each security score, from A (best) to F.
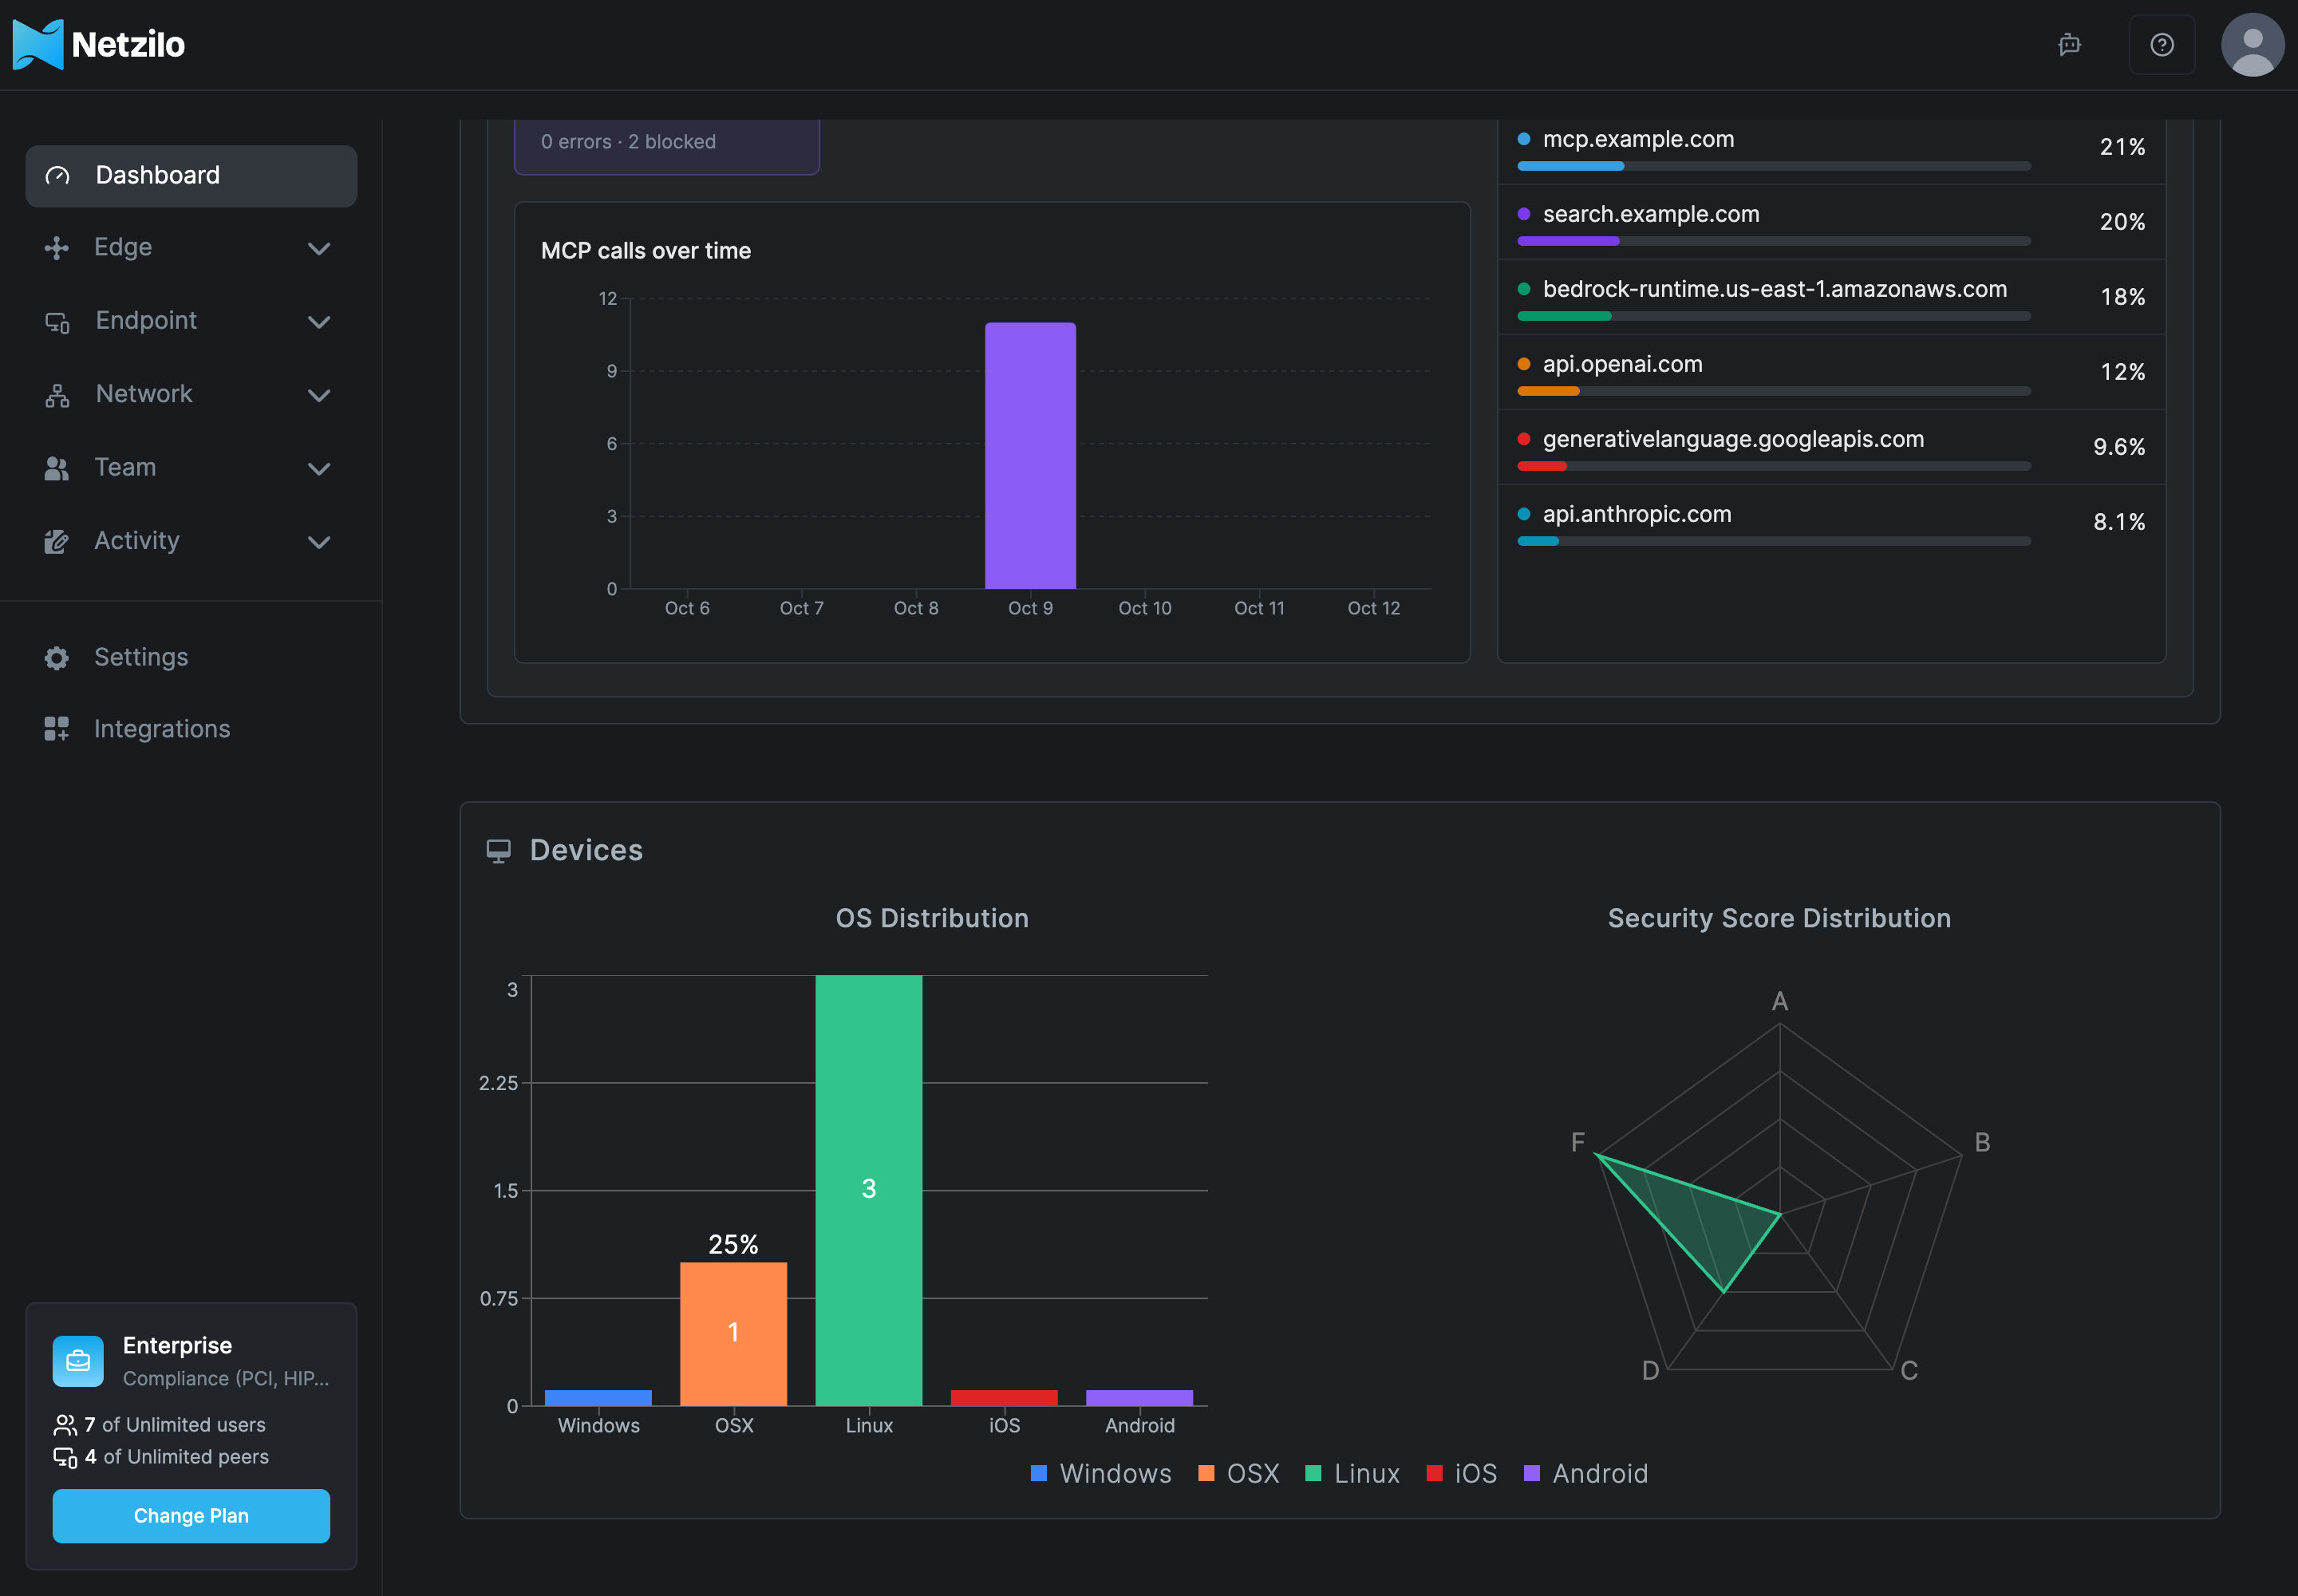
The security score of each device is on its row under Endpoint > Peers. See Peers.
When the account has no device yet, the panel is replaced by Get Started with Netzilo with an Add Peer button. See Install Netzilo.
Read the Dashboard through the API
These calls need an administrator's token. See Agents for tokens.
| Call | Returns |
|---|---|
GET /api/stats | The saved snapshot, or null before the first hourly run |
GET /api/ai/activity?window=24h&scope=org | The window's first page: the totals and one tile per team. window is 24h, 7d or 30d |
GET /api/ai/activity?window=24h&scope=org&offset=0&limit=60&q=sales | A page of the tiles, the most tokens first, of those whose name holds q: limit tiles (at most 200) from offset. total_tiles is how many match and max_tokens the busiest team's tokens |
GET /api/ai/activity?window=24h&scope=group:<group-id> | A team's LLM flow from its users to agents and models, and its MCP flow, mcp_flow, from its users to MCP clients, servers and tools |
GET /api/ai/activity?window=24h&scope=group:<group-id>&people=40 | The same flows over the team's people busiest people (at most 500). The others are one node with the key *others, its others field their number; each flow's people is how many people it has |
GET /api/ai/hive?window=24h&offset=0&combs=100 | A page of the Sessions tab: counts, the sessions by state (isolated, inspected, active, idle, and idle_bands by tokens), a page of combs (at most 200) from offset, and total_combs. Add team=<group-id> for a team's people, user=<user-id> for a person's agents with their sessions (limit sessions per agent, at most 500), and q to search by name |
GET /api/ai/sessions | The sessions, filtered, searched and paged; see AI Sessions |
POST /api/ai/activity/refresh | Builds the snapshot and the views now, as Refresh does |
The GET answers carry an ETag: send it back in If-None-Match to get a 304 Not Modified when nothing changed.
Troubleshooting
Agentic Activity is empty although the AI Gateway works or devices record sessions. The snapshot is computed once an hour. Click Refresh, or generate an AI Usage report, which reads live data.
A team is missing from the window. A team appears when its members had recorded AI sessions in the period. Choose a longer period. A user who is in no group counts only under All.
A session has no messages. Only sessions recorded by the AI Gateway or by a Netzilo client that records AI sessions have messages; browser traffic has none. A call whose content was not captured shows Content not captured for this call.
The Tokens tile shows zero. Nothing was recorded that day. Tokens count the gateway's traffic and the model calls Netzilo clients recorded; browser traffic does not count.
The Sessions tab and the Teams tab count differently. Teams shows the views built every 15 minutes; Sessions reads the sessions live. A team's comb holds the people whose latest session recorded that team as their most specific group, so a person in several groups is in one comb only, while each of their teams' tiles counts them.
A comb shows fewer hexagons than its number. A comb shows at most 250 hexagons, fewer when the page has many combs, in the order isolated, inspected, active, idle. The number next to its name, and its counts on hover, are exact.
The Sessions tab shows Could not load. Netzilo Server builds a few session hives at once for all accounts, so that they never hold up the rest of the server; one that waits too long answers that it is busy. Click Retry, or wait: an open tab reads the hive again on its own every 30 seconds and keeps what it shows until then.
A flow ends with N more people. A team's flow shows its 40 busiest people at first. Scroll to the end of the flow, or click the node, to add more, up to 500.
Where is the Security Score? The Dashboard no longer has a score tile. The Devices panel shows how the scores are distributed, and Endpoint > Peers shows each device's score. Fix a low score by acting on the device's red indicators, or enforce requirements with Posture Checks.
Related Documentation
- AI Sessions - Every recorded AI session, searchable
- AI Usage - Live usage per user, model and server
- AI Agent Activity - Agent activity on devices
- AI Gateway - Run the Netzilo AI Gateway
- Peers - Devices and their security scores
- Events - Every event in the account