

AI Usage
The AI Usage report shows what went through your Netzilo AI Gateway in a period: how many model requests and MCP tool calls, how many tokens, what it cost, how fast it was, and who used which model, provider, server and tool. Use it for cost reviews, capacity planning and to check your limits. Open it from Activity > Reports.
AI Usage counts only traffic through the Netzilo AI Gateway. AI traffic seen by the Netzilo client on devices, by coding-agent hooks or by the Netzilo browser extension is not in it; that traffic is in the AI Agent Activity report.
How it works
- For every model request and every MCP tool call, the AI Gateway records the facts: the user, the gateway, the provider, the model, the status (for example ok, error or blocked), the tokens, the cost in US dollars, the latency and, for MCP, the server and tool. It never records the prompt, the answer, the tool arguments or the result.
- The gateway sends these records to the management server about every 15 seconds.
- When you generate the report, it reads the stored records for the period, so it includes requests made a minute ago. The Dashboard home page, by contrast, shows an hourly snapshot.
Before you start
- A Netzilo AI Gateway that users send their AI traffic through.
- Providers and, for MCP usage, MCP servers configured under Edge.
Create an AI Usage report
- Go to Activity > Reports and click Create Report.
- Select AI Usage as the Report Type.
- Choose the Date Range. The default is the last two weeks.
- Optionally pick Groups. The report then counts only the usage of those groups' members. Leave it empty for everyone.
- Click Save.
The report appears in the table when it is ready. Click the eye icon to view it, or the download icon to save it as a PDF (titled NETZILO AI USAGE REPORT). See Reports for the table and the dialog.
LLM Usage
The LLM Usage tab covers model requests.
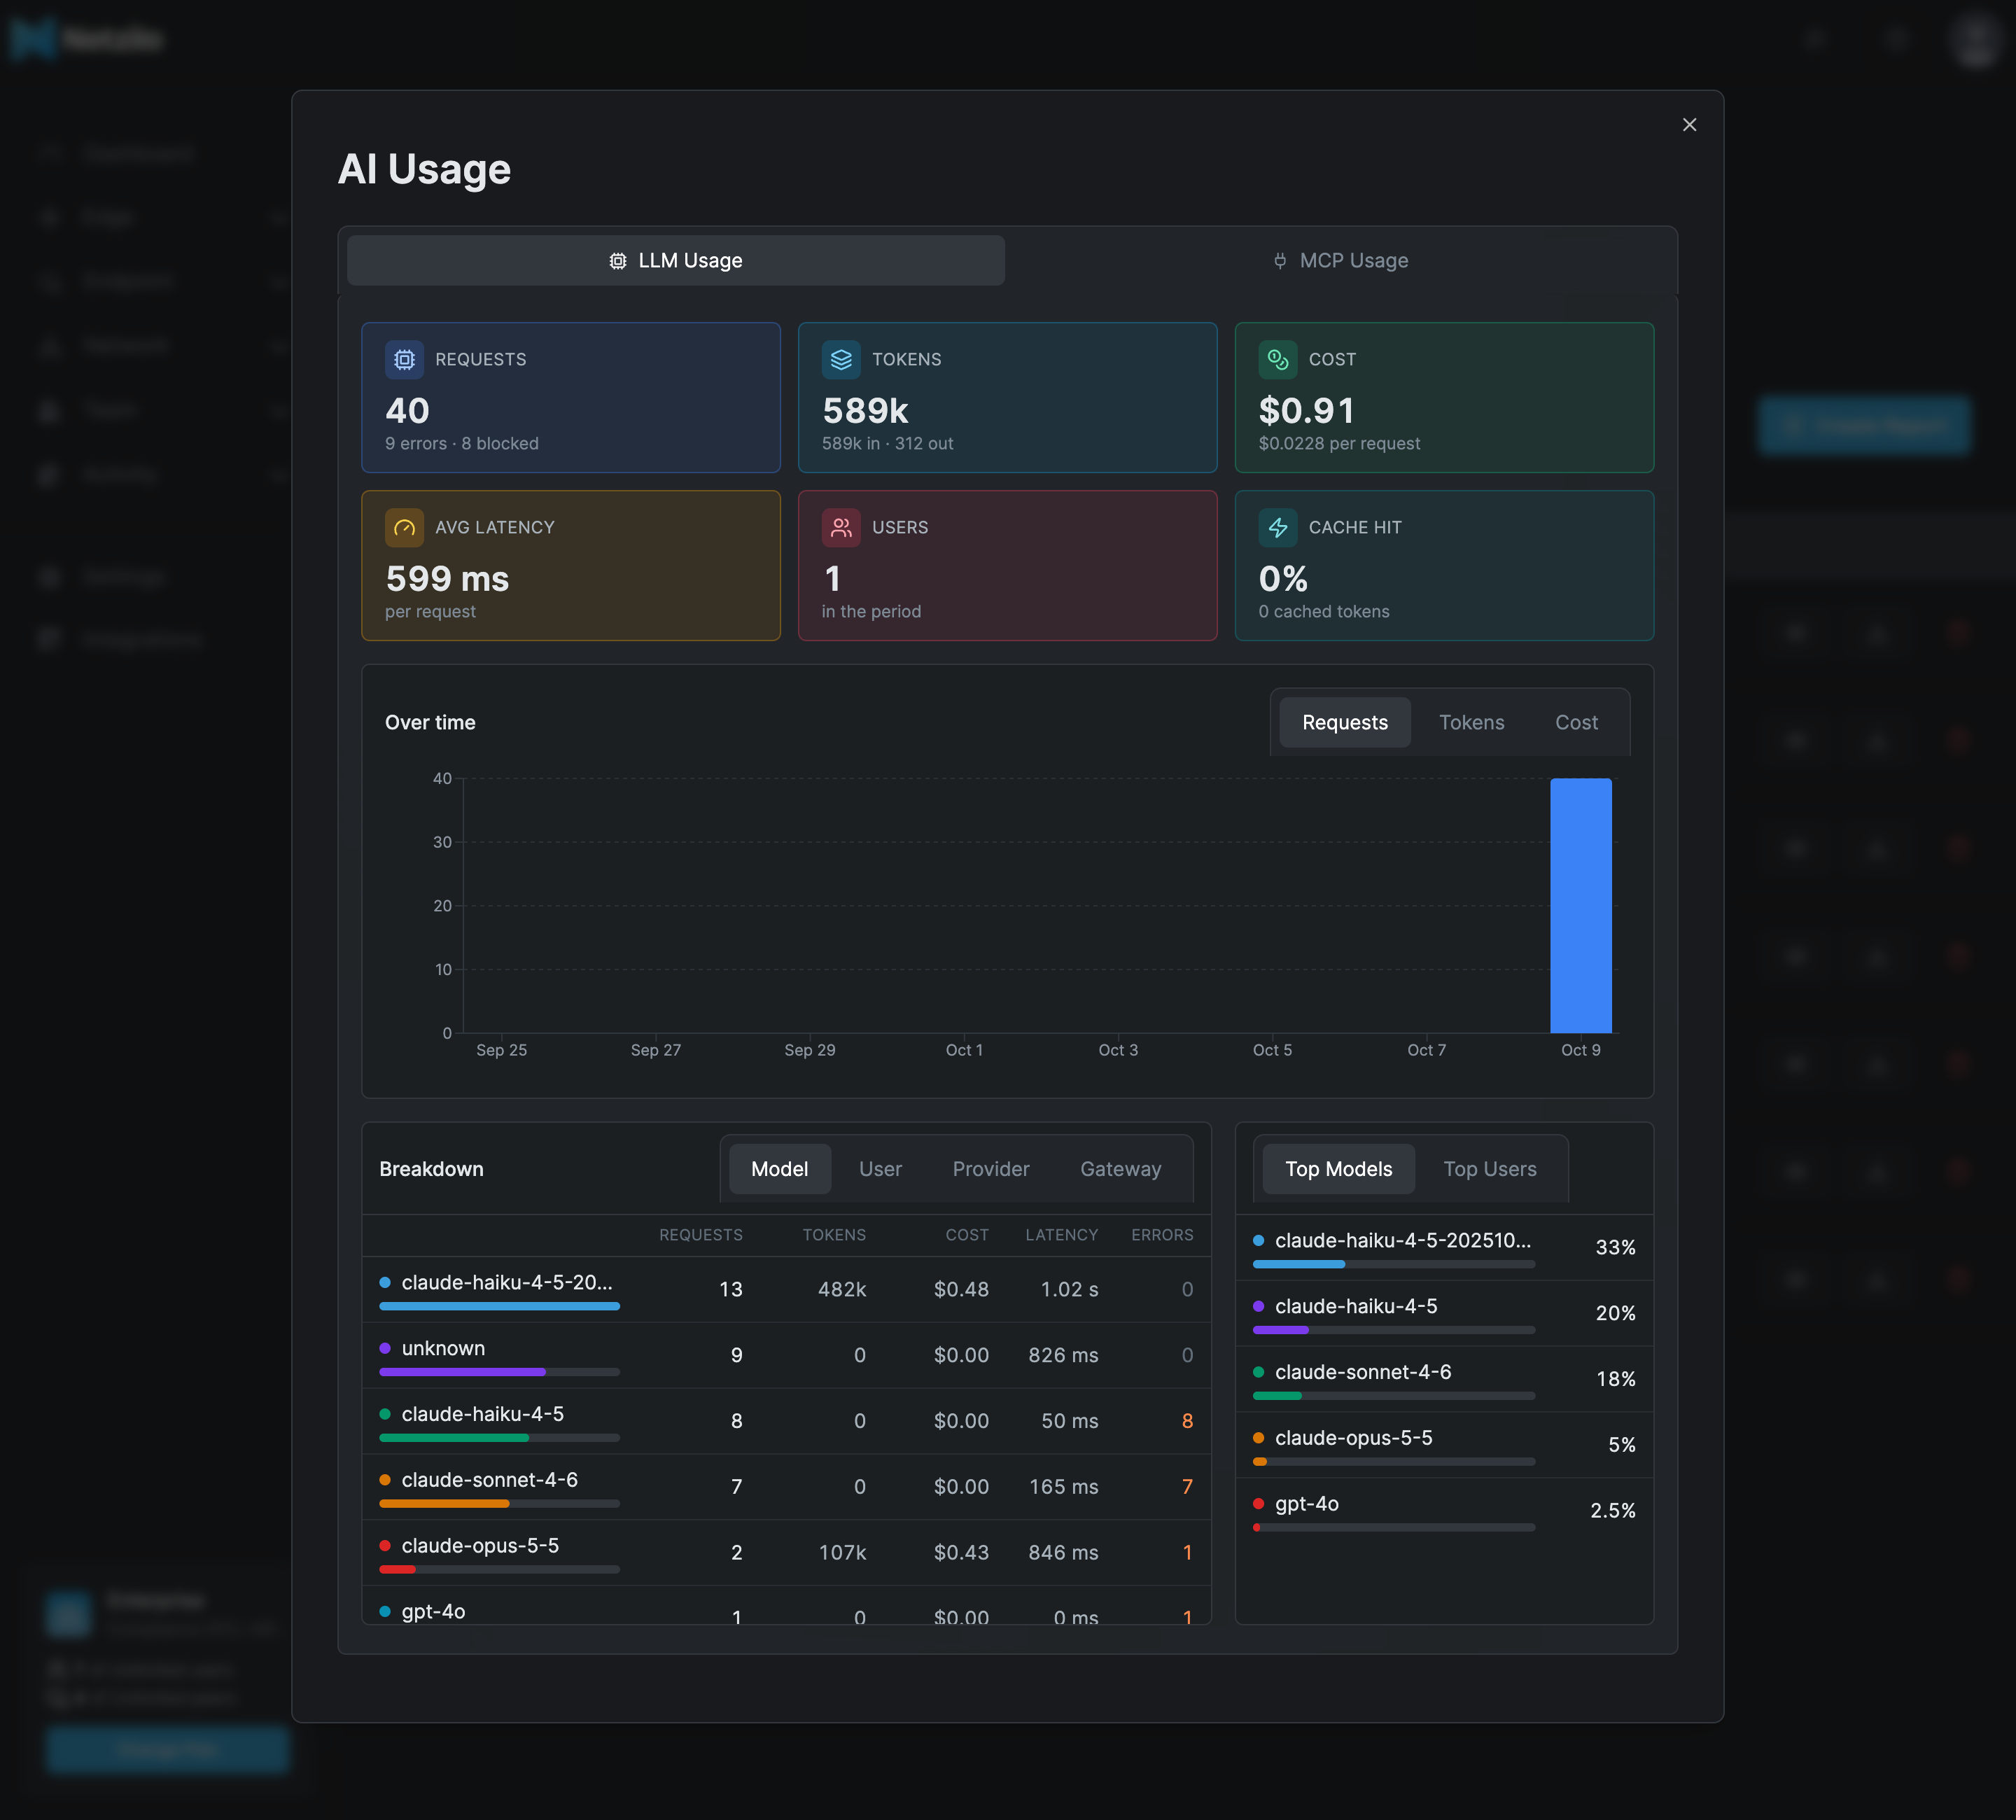
| Card | What it shows |
|---|---|
| Requests | Model requests, with the number of errors and blocked requests. |
| Tokens | All tokens, split into input (in) and output (out). |
| Cost | The total cost in US dollars, and the average per request. |
| Avg Latency | The average time per request. |
| Users | Users who made requests in the period. |
| Cache Hit | The share of input tokens served from the provider's cache, and the number of cached tokens. |
Over time charts Requests, Tokens or Cost. The chart uses hourly bars for periods up to 72 hours and daily bars for longer periods.
Breakdown shows the usage by Model, User, Provider or Gateway, with the requests, tokens, cost, latency and errors of each. It lists up to 20 rows.
Top Models and Top Users show up to six entries with their share.
MCP Usage
The MCP Usage tab covers MCP tool calls made through the AI Gateway.
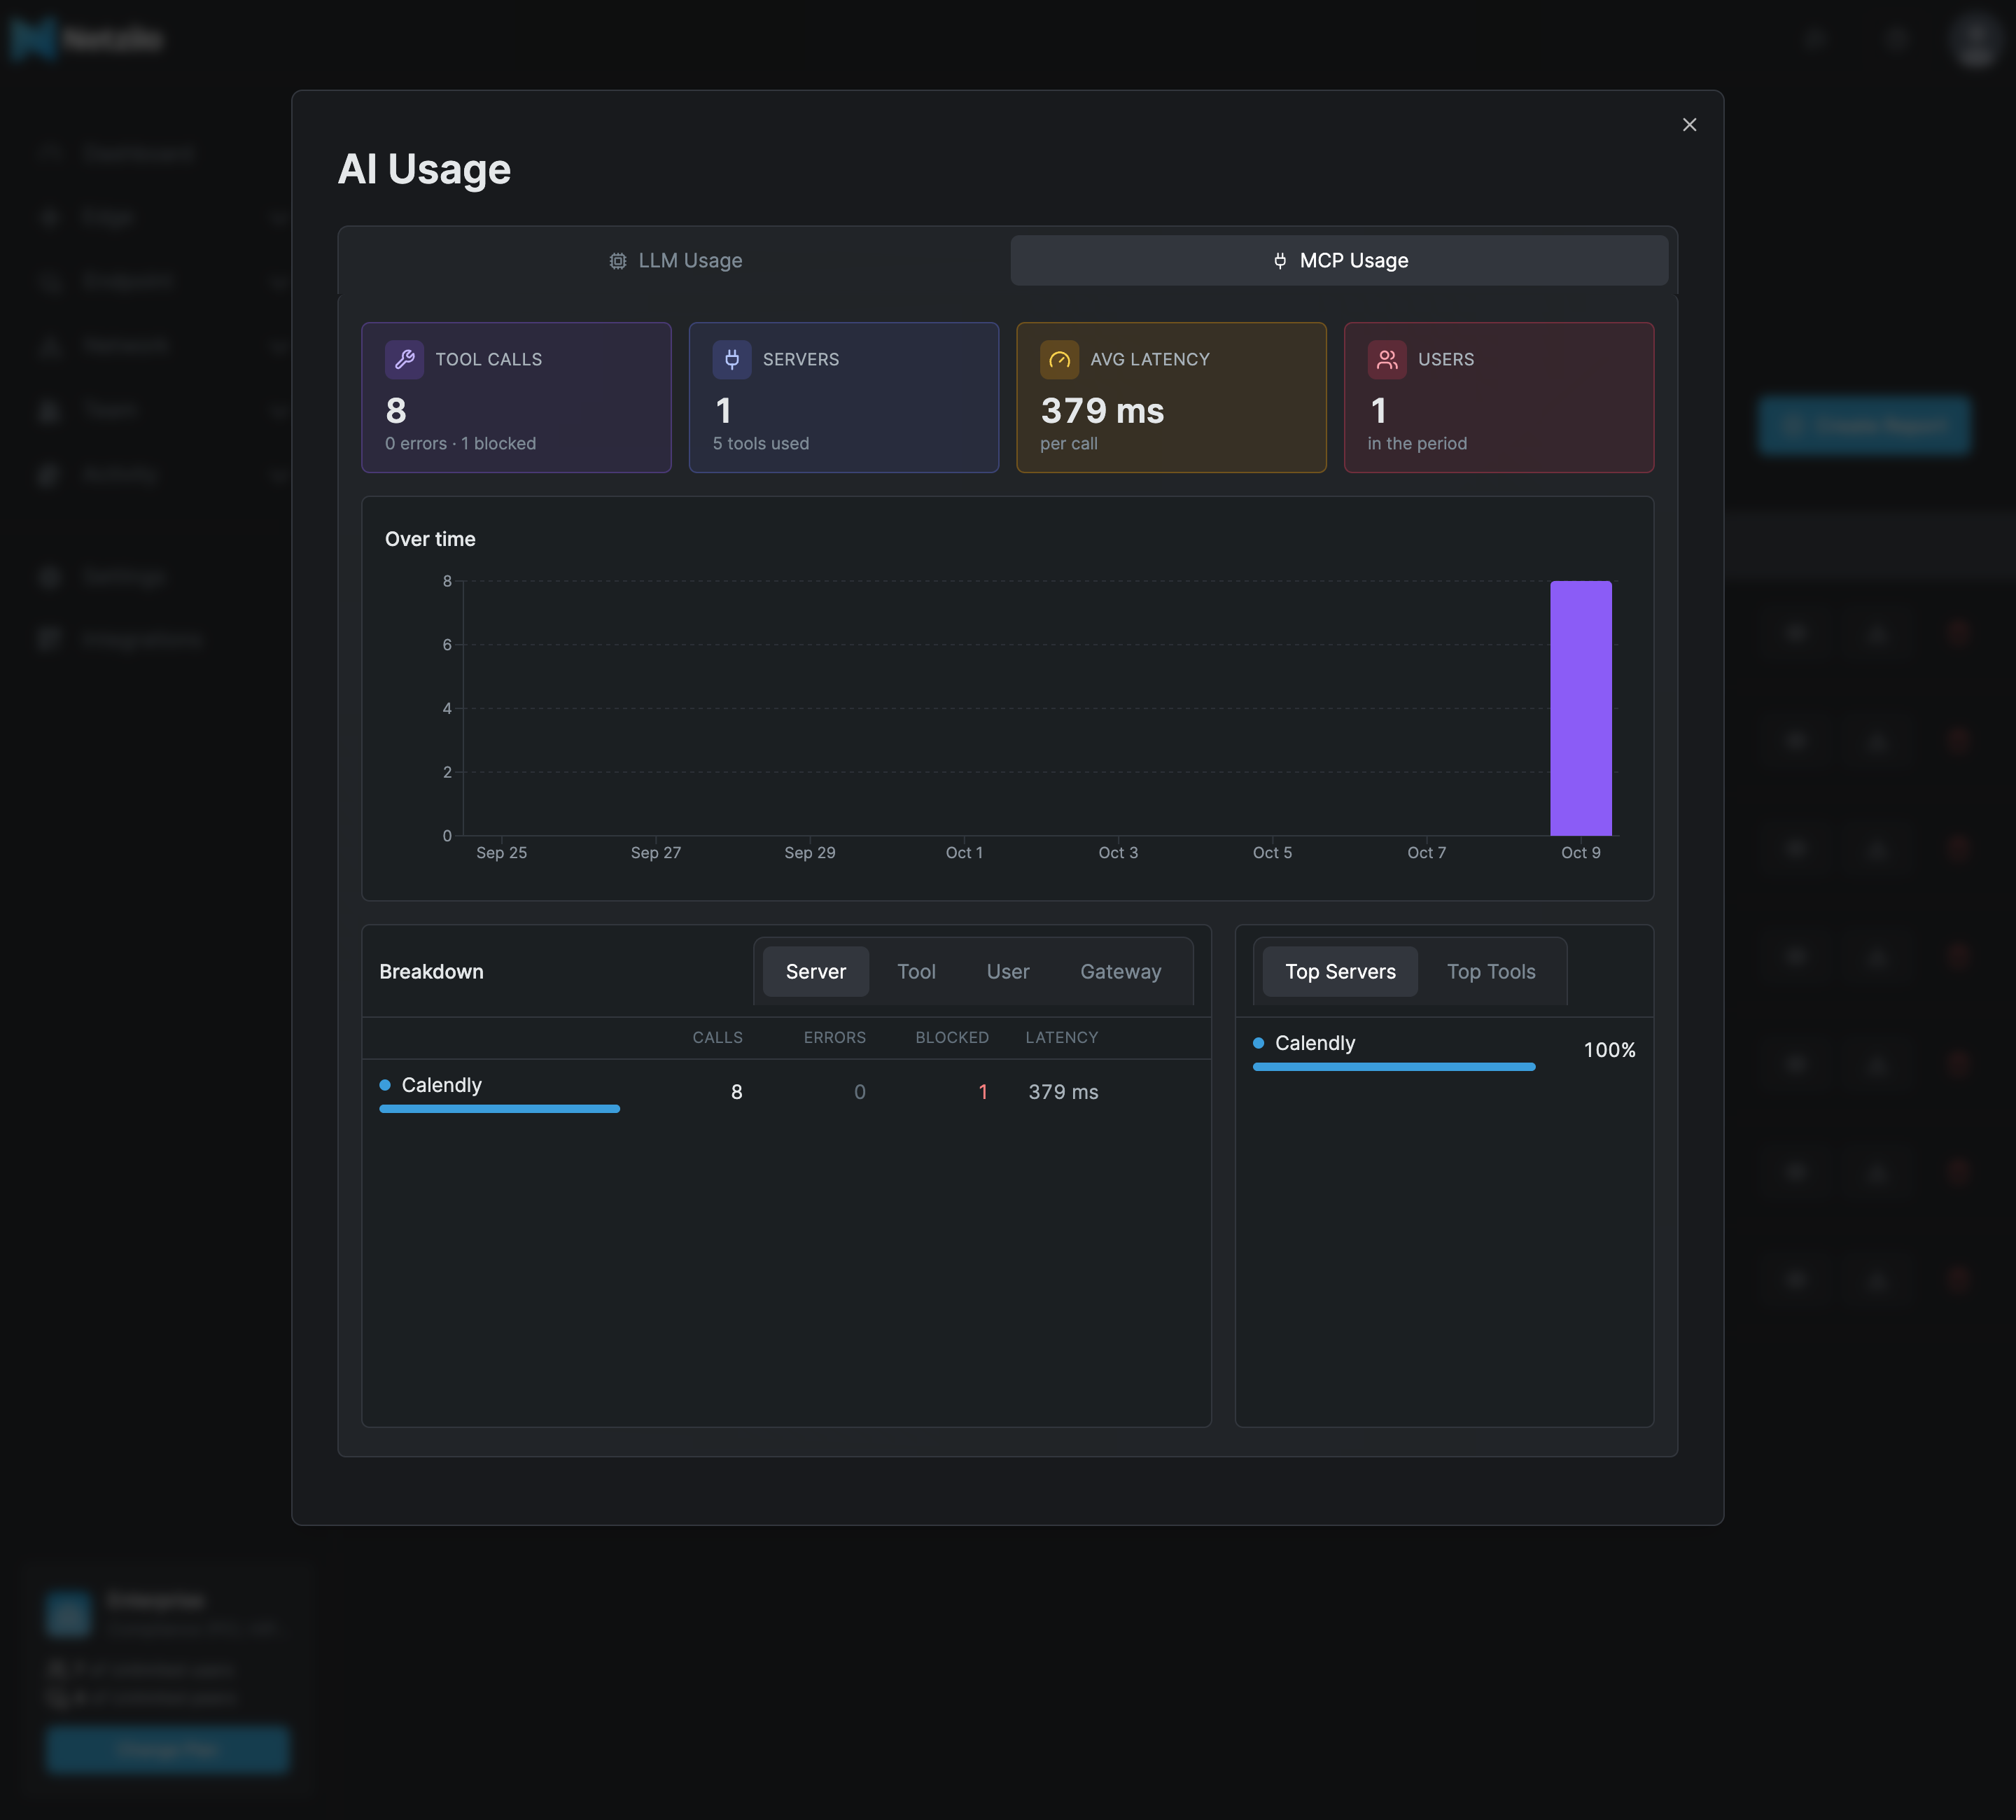
| Card | What it shows |
|---|---|
| Tool Calls | MCP tool calls, with the number of errors and blocked calls. |
| Servers | MCP servers called, and the number of tools used. |
| Avg Latency | The average time per call. |
| Users | Users who made calls in the period. |
Over time charts the tool calls. Breakdown shows the calls by Server, Tool, User or Gateway, with calls, errors, blocked calls and latency, up to 20 rows. Top Servers and Top Tools show up to six entries with their share.
Use the API
Create the report with POST /api/reports and "report_type":"ai_usage". When you pass
groups, the report counts only those groups' members. See
Reports.
Troubleshooting
The report shows No AI gateway usage in this period. Nothing went through the AI Gateway in the period. Device, hook and browser traffic never appears here; use the AI Agent Activity report for it. Also check that the gateway is running and connected.
A breakdown shows Nothing recorded in this period. There is usage, but none for that view, for example no MCP calls by the selected users.
The Dashboard home page shows less than the report. The home page is a snapshot computed every hour. The report reads the live data.
Related Documentation
- Reports - Create, view, download and delete reports
- AI Agent Activity - AI activity from every source, with violations
- AI Gateway - How the Netzilo AI Gateway works
- Providers - The model providers behind the gateway
- Limits - Spend, token and request limits per user
- Dashboard - Hourly overview of agentic activity